
Kentucky
Click the links below to view state facts.
Kentucky Population News Articles
Population Density
Historic & Projected Growth
Population by County
POPULATION DENSITY
People per square mile, 2010: 109.9
People per square mile, 2020: 114.1
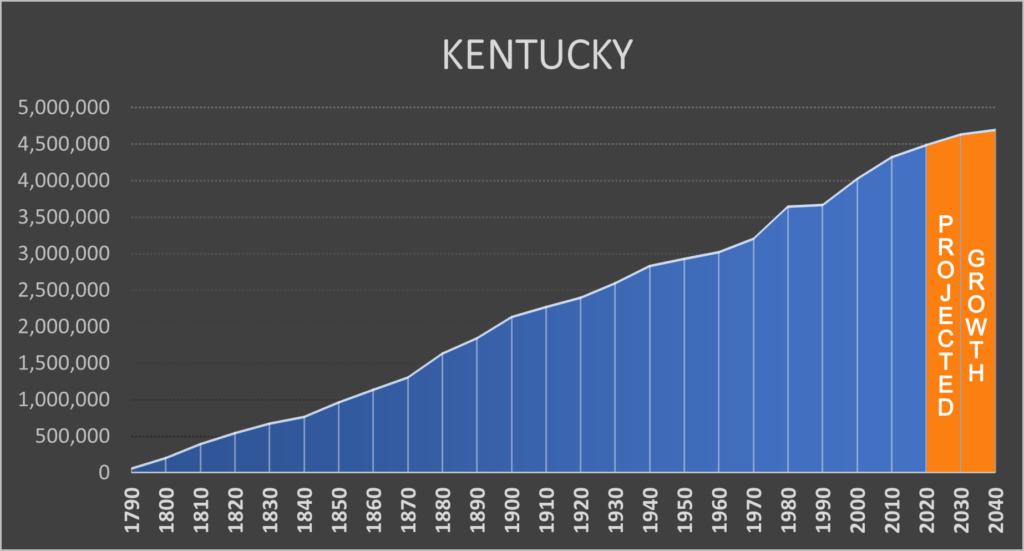
HISTORIC & PROJECTED GROWTH 1790 TO 2040
Year |
Population |
1790 |
73,677 |
1800 |
220,955 |
1810 |
406,511 |
1820 |
564,317 |
1830 |
687,917 |
1840 |
779,828 |
1850 |
982,405 |
1860 |
1,155,684 |
1870 |
1,321,011 |
1880 |
1,648,690 |
1890 |
1,858,635 |
1900 |
2,147,174 |
1910 |
2,289,905 |
1920 |
2,416,630 |
1930 |
2,614,589 |
1940 |
2,845,627 |
1950 |
2,944,806 |
1960 |
3,038,156 |
1970 |
3,220,711 |
1980 |
3,660,324 |
1990 |
3,685,296 |
2000 |
4,041,769 |
2010 |
4,339,367 |
2020 |
4,505,836 |
2030 |
*4,648,190 |
2040 |
*4,714,761 |
Sources: Census figures from U.S. Bureau of the Census & *Estimates from Weldon Cooper Center, Demographics Research Group(The Census Bureau and Weldon Cooper Center have not yet provided updated State projections to reflect 2020 census numbers.)
Population by County
Population By County |
Census 2020 Population |
Census 2010 Population |
Change from 2010 |
Percent Change |
KENTUCKY |
4,505,836 |
4,339,367 |
166469 |
3.84% |
Adair County |
18,903 |
18,656 |
247 |
1.32% |
Allen County |
20,588 |
19,956 |
632 |
3.17% |
Anderson County |
23,852 |
21,421 |
2431 |
11.35% |
Ballard County |
7,728 |
8,249 |
-521 |
-6.32% |
Barren County |
44,485 |
42,173 |
2312 |
5.48% |
Bath County |
12,750 |
11,591 |
1159 |
10.00% |
Bell County |
24,097 |
28,691 |
-4594 |
-16.01% |
Boone County |
135,968 |
118,811 |
17157 |
14.44% |
Bourbon County |
20,252 |
19,985 |
267 |
1.34% |
Boyd County |
48,261 |
49,542 |
-1281 |
-2.59% |
Boyle County |
30,614 |
28,432 |
2182 |
7.67% |
Bracken County |
8,400 |
8,488 |
-88 |
-1.04% |
Breathitt County |
13,718 |
13,878 |
-160 |
-1.15% |
Breckinridge County |
20,432 |
20,059 |
373 |
1.86% |
Bullitt County |
82,217 |
74,319 |
7898 |
10.63% |
Butler County |
12,371 |
12,690 |
-319 |
-2.51% |
Caldwell County |
12,649 |
12,984 |
-335 |
-2.58% |
Calloway County |
37,103 |
37,191 |
-88 |
-0.24% |
Campbell County |
93,076 |
90,336 |
2740 |
3.03% |
Carlisle County |
4,826 |
5,104 |
-278 |
-5.45% |
Carroll County |
10,810 |
10,811 |
-1 |
-0.01% |
Carter County |
26,627 |
27,720 |
-1093 |
-3.94% |
Casey County |
15,941 |
15,955 |
-14 |
-0.09% |
Christian County |
72,748 |
73,955 |
-1207 |
-1.63% |
Clark County |
36,972 |
35,613 |
1359 |
3.82% |
Clay County |
20,345 |
21,730 |
-1385 |
-6.37% |
Clinton County |
9,253 |
10,272 |
-1019 |
-9.92% |
Crittenden County |
8,990 |
9,315 |
-325 |
-3.49% |
Cumberland County |
5,888 |
6,856 |
-968 |
-14.12% |
Daviess County |
103,312 |
96,656 |
6656 |
6.89% |
Edmonson County |
12,126 |
12,161 |
-35 |
-0.29% |
Elliott County |
7,354 |
7,852 |
-498 |
-6.34% |
Estill County |
14,163 |
14,672 |
-509 |
-3.47% |
Fayette County |
322,570 |
295,803 |
26767 |
9.05% |
Fleming County |
15,082 |
14,348 |
734 |
5.12% |
Floyd County |
35,942 |
39,451 |
-3509 |
-8.89% |
Franklin County |
51,541 |
49,285 |
2256 |
4.58% |
Fulton County |
6,515 |
6,813 |
-298 |
-4.37% |
Gallatin County |
8,690 |
8,589 |
101 |
1.18% |
Garrard County |
16,953 |
16,912 |
41 |
0.24% |
Grant County |
24,941 |
24,662 |
279 |
1.13% |
Graves County |
36,649 |
37,121 |
-472 |
-1.27% |
Grayson County |
26,420 |
25,746 |
674 |
2.62% |
Green County |
11,107 |
11,258 |
-151 |
-1.34% |
Greenup County |
35,962 |
36,910 |
-948 |
-2.57% |
Hancock County |
9,095 |
8,565 |
530 |
6.19% |
Hardin County |
110,702 |
105,543 |
5159 |
4.89% |
Harlan County |
26,831 |
29,278 |
-2447 |
-8.36% |
Harrison County |
18,692 |
18,846 |
-154 |
-0.82% |
Hart County |
19,288 |
18,199 |
1089 |
5.98% |
Henderson County |
44,793 |
46,250 |
-1457 |
-3.15% |
Henry County |
15,678 |
15,416 |
262 |
1.70% |
Hickman County |
4,521 |
4,902 |
-381 |
-7.77% |
Hopkins County |
45,423 |
46,920 |
-1497 |
-3.19% |
Jackson County |
12,955 |
13,494 |
-539 |
-3.99% |
Jefferson County |
782,969 |
741,096 |
41873 |
5.65% |
Jessamine County |
52,991 |
48,586 |
4405 |
9.07% |
Johnson County |
22,680 |
23,356 |
-676 |
-2.89% |
Kenton County |
169,064 |
159,720 |
9344 |
5.85% |
Knott County |
14,251 |
16,346 |
-2095 |
-12.82% |
Knox County |
30,193 |
31,883 |
-1690 |
-5.30% |
Larue County |
14,867 |
14,193 |
674 |
4.75% |
Laurel County |
62,613 |
58,849 |
3764 |
6.40% |
Lawrence County |
16,293 |
15,860 |
433 |
2.73% |
Lee County |
7,395 |
7,887 |
-492 |
-6.24% |
Leslie County |
10,513 |
11,310 |
-797 |
-7.05% |
Letcher County |
21,548 |
24,519 |
-2971 |
-12.12% |
Lewis County |
13,080 |
13,870 |
-790 |
-5.70% |
Lincoln County |
24,275 |
24,742 |
-467 |
-1.89% |
Livingston County |
8,888 |
9,519 |
-631 |
-6.63% |
Logan County |
27,432 |
26,835 |
597 |
2.22% |
Lyon County |
8,680 |
8,314 |
366 |
4.40% |
McCracken County |
67,875 |
65,565 |
2310 |
3.52% |
McCreary County |
16,888 |
18,306 |
-1418 |
-7.75% |
McLean County |
9,152 |
9,531 |
-379 |
-3.98% |
Madison County |
92,701 |
82,916 |
9785 |
11.80% |
Magoffin County |
11,637 |
13,333 |
-1696 |
-12.72% |
Marion County |
19,581 |
19,820 |
-239 |
-1.21% |
Marshall County |
31,659 |
31,448 |
211 |
0.67% |
Martin County |
11,287 |
12,929 |
-1642 |
-12.70% |
Mason County |
17,120 |
17,490 |
-370 |
-2.12% |
Meade County |
30,003 |
28,602 |
1401 |
4.90% |
Menifee County |
6,113 |
6,306 |
-193 |
-3.06% |
Mercer County |
22,641 |
21,331 |
1310 |
6.14% |
Metcalfe County |
10,286 |
10,099 |
187 |
1.85% |
Monroe County |
11,338 |
10,963 |
375 |
3.42% |
Montgomery County |
28,114 |
26,499 |
1615 |
6.09% |
Morgan County |
13,726 |
13,923 |
-197 |
-1.41% |
Muhlenberg County |
30,928 |
31,499 |
-571 |
-1.81% |
Nelson County |
46,738 |
43,437 |
3301 |
7.60% |
Nicholas County |
7,537 |
7,135 |
402 |
5.63% |
Ohio County |
23,772 |
23,842 |
-70 |
-0.29% |
Oldham County |
67,607 |
60,316 |
7291 |
12.09% |
Owen County |
11,278 |
10,841 |
437 |
4.03% |
Owsley County |
4,051 |
4,755 |
-704 |
-14.81% |
Pendleton County |
14,644 |
14,877 |
-233 |
-1.57% |
Perry County |
28,473 |
28,712 |
-239 |
-0.83% |
Pike County |
58,669 |
65,024 |
-6355 |
-9.77% |
Powell County |
13,129 |
12,613 |
516 |
4.09% |
Pulaski County |
65,034 |
63,063 |
1971 |
3.13% |
Robertson County |
2,193 |
2,282 |
-89 |
-3.90% |
Rockcastle County |
16,037 |
17,056 |
-1019 |
-5.97% |
Rowan County |
24,662 |
23,333 |
1329 |
5.70% |
Russell County |
17,991 |
17,565 |
426 |
2.43% |
Scott County |
57,155 |
47,173 |
9982 |
21.16% |
Shelby County |
48,065 |
42,074 |
5991 |
14.24% |
Simpson County |
19,594 |
17,327 |
2267 |
13.08% |
Spencer County |
19,490 |
17,061 |
2429 |
14.24% |
Taylor County |
26,023 |
24,512 |
1511 |
6.16% |
Todd County |
12,243 |
12,460 |
-217 |
-1.74% |
Trigg County |
14,061 |
14,339 |
-278 |
-1.94% |
Trimble County |
8,474 |
8,809 |
-335 |
-3.80% |
Union County |
13,668 |
15,007 |
-1339 |
-8.92% |
Warren County |
134,554 |
113,792 |
20762 |
18.25% |
Washington County |
12,027 |
11,717 |
310 |
2.65% |
Wayne County |
19,555 |
20,813 |
-1258 |
-6.04% |
Webster County |
13,017 |
13,621 |
-604 |
-4.43% |
Whitley County |
36,712 |
35,637 |
1075 |
3.02% |
Wolfe County |
6,562 |
7,355 |
-793 |
-10.78% |
Woodford County |
26,871 |
24,939 |
1932 |
7.75% |
SOURCE: U.S. Bureau of the Census
Kentucky Population News Articles
People are moving to Kentucky from these states the most, Census data shows – Mar 3, 2026
Helping trees — and Louisville — outrace climate change – Mar 2, 2026
Is Bell County, KY’s population growing or shrinking?– Feb 18, 2026
Amid Mounting Harms, Kentucky Is Ramping Up Anti-Immigrant Enforcement –
Feb 5, 2026
Rubbertown residents voice concerns over Kentucky’s new hyperscale data center – Oct 21, 2025
Lexington nonprofit records a drop in the unhoused population, but shelter needs still remain – Oct 9, 2025
Ky rural economy report finds population growth occurring – Oct 7, 2025
Kentucky trails nation on new climate and health scorecard – Sep 26, 2025
Thousands of undocumented immigrants live in Kentucky, contribute millions to economy – June 24, 2025
Kentucky Ranks Among Worst States For Outdoor Enthusiasts In 2025 – June 24, 2025
In Louisville, schools are being built on contaminated land. How are kids, staff kept safe? – June 22, 2025
Louisville wants to stop requiring special gas sales to fight ozone – June 8, 2025
Officials report dramatic water rise at iconic lake after extreme weather — here’s why this matters – June 5, 2025
Experts explain why more tornadoes are happening in Kentucky – May 28, 2025
Counties in Kentucky where landslides pose the greatest threat – Dec 2, 2024
Immigrant-owned businesses in Louisville creating cultural hubs, boosting economy – Nov 23, 2024
Counties with the worst droughts in Kentucky – Nov 22, 2024
Weather is a major factor in bridge safety in Kentucky and Indiana – Nov 16, 2024
Potential for solar energy use under investigation in Lexington – Nov 14, 2024
Kentucky lawmakers discuss immigration law enforcement – Nov 12, 2024
Kentucky announces solid waste recycling grants – Sept 20, 2024
From grassroots to government, Kentuckians will gather this month to talk about climate change – Sept 16, 2024
28.2% of Kentucky Residents Are Experiencing Drought Conditions in 2024 – Sept 4, 2024
New UofL study reveals health benefits of increased tree coverage in Louisville – Aug 27, 2024
City leaders seek input on shelter access as Louisville’s homeless population grows – Aug 26, 2024
Uncovering Kentucky’s fastest-growing areas – July 1, 2024
Housing gap in Northern Kentucky: Boone County faces largest shortage – June 27, 2024
Kentucky forest at risk: Daniel Boone National Forest – June 19, 2024
Kentucky receives $74 million for abandoned mine land cleanup – June 13, 2024
Where refugees in Kentucky are arriving from – June 10, 2024
Kentucky company slapped with $1.25 million fine for selling ‘defeat devices’ – June 5, 2024
Ky. nets federal funding for coal mine cleanups, major bridge rebuild – October 27, 2023
Coal-fired power failures during winter storm come to light months later – October 25, 2023
Kentucky announces more electric vehicle fast-charging sites – October 23, 2023
New Library series celebrates history and culture of Louisville’s immigrant and refugee communities – October 23, 2023
The 7 Fastest Growing Towns in Kentucky Everyone is Talking About – October 20, 2023
Kentucky among most vulnerable states to climate change impacts, says new research – October 5, 2023
3 Kentucky counties could see ‘1-in-a-100-year storms’ every decade, new research shows – July 10, 2023
State, FEMA bringing more homes to Letcher’s flood survivors – July 7, 2023
More than $21 million approved for Eastern Ky. road continually threatened by flooding – June 23, 2023
Taking stock: How climate change is affecting Kentucky – June 21, 2023
Population growth encouraging to city officials – June 16, 2023
Metro Council approves rezoning request for affordable housing near Prospect – December 16, 2022
‘People won’t be able to afford that’; Community raises concerns about proposed utility increases – December 12, 2022
$4M homeless plan among motions approved at City Commission meeting – December 6, 2022
TVA pilot project in western Ky. to put solar farm on coal ash landfill – December 6, 2022
Farmers say current drought is having a ‘devastating’ impact on harvesting season – July 17, 2022
Kentuckians demand utility regulators consider climate change in long-term planning – July 13, 2022
More than half of Kentucky in moderate drought category – July 8, 2022
Water distribution begins in Marion to ease burden on dwindling water supply – June 24, 2022
Grayson gets $970k in water grants – March 18, 2022
Study says climate change will make allergy seasons worse – March 16, 2022
Project aims to undo ‘degradation’ of Kentucky stream. Why it matters for habitat, state – March 14, 2022
Kentucky to receive nearly $9 million for abandoned mine land efforts – March 5, 2022
Report says poor road conditions cost drivers time, money – February 19, 2022