
Texas
Click the links below to view state facts.
Population News Articles
Population Density
Historic & Projected Growth
Population by County
POPULATION DENSITY
People per square mile, 2010: 96.3
People per square mile, 2020: 111.6
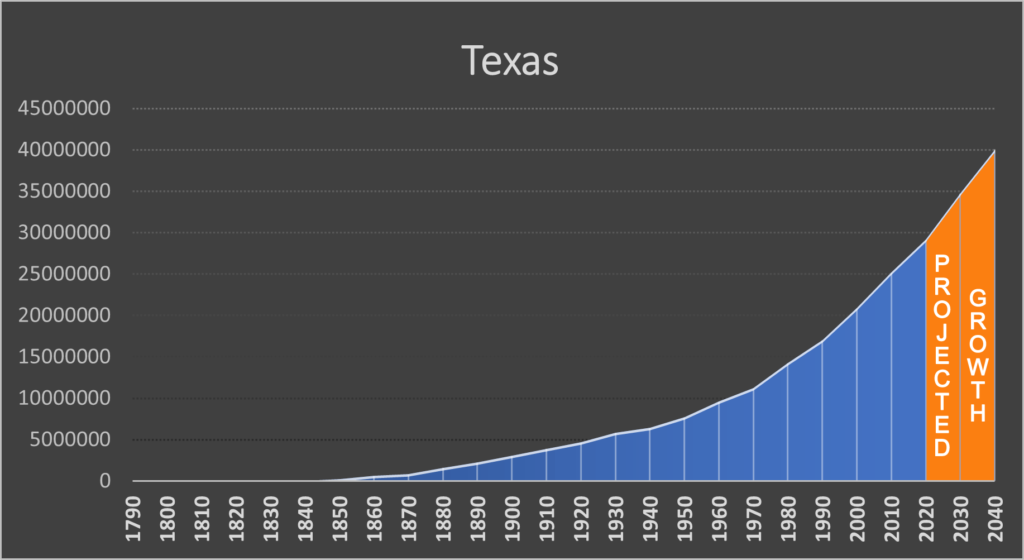
HISTORIC & PROJECTED GROWTH 1790 TO 2040
Year |
Population |
1790 |
0 |
1800 |
0 |
1810 |
0 |
1820 |
0 |
1830 |
0 |
1840 |
0 |
1850 |
212,592 |
1860 |
604,215 |
1870 |
818,579 |
1880 |
1,591,749 |
1890 |
2,235,527 |
1900 |
3,048,710 |
1910 |
3,896,542 |
1920 |
4,663,228 |
1930 |
5,824,715 |
1940 |
6,414,824 |
1950 |
7,711,194 |
1960 |
9,579,677 |
1970 |
11,198,655 |
1980 |
14,225,513 |
1990 |
16,986,510 |
2000 |
20,851,820 |
2010 |
25,145,561 |
2020 |
29,145,505 |
2030 |
*34,738,482 |
2040 |
*40,015,913 |
Sources: Census figures from U.S. Bureau of the Census & *Estimates from Weldon Cooper Center, Demographics Research Group
(The Census Bureau and Weldon Cooper Center have not yet provided updated State projections to reflect 2020 census numbers.)
Population by County
Census 2020 Population |
Census 2010 Population |
Change from 2020 |
Percent Change |
|
TEXAS |
29,145,505 |
25,145,561 |
3,999,944 |
15.91% |
Anderson County |
57922 |
58,458 |
-536 |
-0.92% |
Andrews County |
18610 |
14,786 |
3,824 |
25.86% |
Angelina County |
86395 |
86,771 |
-376 |
-0.43% |
Aransas County |
23830 |
23,158 |
672 |
2.90% |
Archer County |
8560 |
9,054 |
-494 |
-5.46% |
Armstrong County |
1848 |
1,901 |
-53 |
-2.79% |
Atascosa County |
48981 |
44,911 |
4,070 |
9.06% |
Austin County |
30167 |
28,417 |
1,750 |
6.16% |
Bailey County |
6904 |
7,165 |
-261 |
-3.64% |
Bandera County |
20851 |
20,485 |
366 |
1.79% |
Bastrop County |
97216 |
74,171 |
23,045 |
31.07% |
Baylor County |
3465 |
3,726 |
-261 |
-7.00% |
Bee County |
31047 |
31,861 |
-814 |
-2.55% |
Bell County |
370647 |
310,235 |
60,412 |
19.47% |
Bexar County |
2009324 |
1,714,773 |
294,551 |
17.18% |
Blanco County |
11374 |
10,497 |
877 |
8.35% |
Borden County |
631 |
641 |
-10 |
-1.56% |
Bosque County |
18235 |
18,212 |
23 |
0.13% |
Bowie County |
92893 |
92,565 |
328 |
0.35% |
Brazoria County |
372031 |
313,166 |
58,865 |
18.80% |
Brazos County |
233849 |
194,851 |
38,998 |
20.01% |
Brewster County |
9546 |
9,232 |
314 |
3.40% |
Briscoe County |
1435 |
1,637 |
-202 |
-12.34% |
Brooks County |
7076 |
7,223 |
-147 |
-2.04% |
Brown County |
38095 |
38,106 |
-11 |
-0.03% |
Burleson County |
17642 |
17,187 |
455 |
2.65% |
7\ |
49130 |
42,750 |
6,380 |
14.92% |
Caldwell County |
45883 |
38,066 |
7,817 |
20.54% |
Calhoun County |
20106 |
21,381 |
-1,275 |
-5.96% |
Callahan County |
13708 |
13,544 |
164 |
1.21% |
Cameron County |
421017 |
406,220 |
14,797 |
3.64% |
Camp County |
12464 |
12,401 |
63 |
0.51% |
Carson County |
5807 |
6,182 |
-375 |
-6.07% |
Cass County |
28454 |
30,464 |
-2,010 |
-6.60% |
Castro County |
7371 |
8,062 |
-691 |
-8.57% |
Chambers County |
46571 |
35,096 |
11,475 |
32.70% |
Cherokee County |
50412 |
50,845 |
-433 |
-0.85% |
Childress County |
6664 |
7,041 |
-377 |
-5.35% |
Clay County |
10218 |
10,752 |
-534 |
-4.97% |
Cochran County |
2547 |
3,127 |
-580 |
-18.55% |
Coke County |
3285 |
3,320 |
-35 |
-1.05% |
Coleman County |
7684 |
8,895 |
-1,211 |
-13.61% |
Collin County |
1064465 |
782,341 |
282,124 |
36.06% |
Collingsworth County |
2652 |
3,057 |
-405 |
-13.25% |
Colorado County |
20557 |
20,874 |
-317 |
-1.52% |
Comal County |
161501 |
108,472 |
53,029 |
48.89% |
Comanche County |
13594 |
13,974 |
-380 |
-2.72% |
Concho County |
3303 |
4,087 |
-784 |
-19.18% |
Cooke County |
41668 |
38,437 |
3,231 |
8.41% |
Coryell County |
83093 |
75,388 |
7,705 |
10.22% |
Cottle County |
1380 |
1,505 |
-125 |
-8.31% |
Crane County |
4675 |
4,375 |
300 |
6.86% |
Crockett County |
3098 |
3,719 |
-621 |
-16.70% |
Crosby County |
5133 |
6,059 |
-926 |
-15.28% |
Culberson County |
2188 |
2,398 |
-210 |
-8.76% |
Dallam County |
7115 |
6,703 |
412 |
6.15% |
Dallas County |
2613539 |
2,368,139 |
245,400 |
10.36% |
Dawson County |
12456 |
13,833 |
-1,377 |
-9.95% |
Deaf Smith County |
18583 |
19,372 |
-789 |
-4.07% |
Delta County |
5230 |
5,231 |
-1 |
-0.02% |
Denton County |
906422 |
662,614 |
243,808 |
36.79% |
DeWitt County |
19824 |
20,097 |
-273 |
-1.36% |
Dickens County |
1770 |
2,444 |
-674 |
-27.58% |
Dimmit County |
8615 |
9,996 |
-1,381 |
-13.82% |
Donley County |
3258 |
3,677 |
-419 |
-11.40% |
Duval County |
9831 |
11,782 |
-1,951 |
-16.56% |
Eastland County |
17725 |
18,583 |
-858 |
-4.62% |
Ector County |
165171 |
137,130 |
28,041 |
20.45% |
Edwards County |
1422 |
2,002 |
-580 |
-28.97% |
Ellis County |
192455 |
149,610 |
42,845 |
28.64% |
El Paso County |
865657 |
800,647 |
65,010 |
8.12% |
Erath County |
42545 |
37,890 |
4,655 |
12.29% |
Falls County |
16968 |
17,866 |
-898 |
-5.03% |
Fannin County |
35662 |
33,915 |
1,747 |
5.15% |
Fayette County |
24435 |
24,554 |
-119 |
-0.48% |
Fisher County |
3672 |
3,974 |
-302 |
-7.60% |
Floyd County |
5402 |
6,446 |
-1,044 |
-16.20% |
Foard County |
1095 |
1,336 |
-241 |
-18.04% |
Fort Bend County |
822779 |
585,375 |
237,404 |
40.56% |
Franklin County |
10359 |
10,605 |
-246 |
-2.32% |
Freestone County |
19435 |
19,816 |
-381 |
-1.92% |
Frio County |
18385 |
17,217 |
1,168 |
6.78% |
Gaines County |
21598 |
17,526 |
4,072 |
23.23% |
Galveston County |
350682 |
291,309 |
59,373 |
20.38% |
Garza County |
5816 |
6,461 |
-645 |
-9.98% |
Gillespie County |
26725 |
24,837 |
1,888 |
7.60% |
Glasscock County |
1116 |
1,226 |
-110 |
-8.97% |
Goliad County |
7012 |
7,210 |
-198 |
-2.75% |
Gonzales County |
19653 |
19,807 |
-154 |
-0.78% |
Gray County |
21227 |
22,535 |
-1,308 |
-5.80% |
Grayson County |
135543 |
120,877 |
14,666 |
12.13% |
Gregg County |
124239 |
121,730 |
2,509 |
2.06% |
Grimes County |
29268 |
26,604 |
2,664 |
10.01% |
Guadalupe County |
172706 |
131,533 |
41,173 |
31.30% |
Hale County |
32522 |
36,273 |
-3,751 |
-10.34% |
Hall County |
2825 |
3,353 |
-528 |
-15.75% |
Hamilton County |
8222 |
8,517 |
-295 |
-3.46% |
Hansford County |
5285 |
5,613 |
-328 |
-5.84% |
Hardeman County |
3549 |
4,139 |
-590 |
-14.25% |
Hardin County |
56231 |
54,635 |
1,596 |
2.92% |
Harris County |
4731145 |
4,092,459 |
638,686 |
15.61% |
Harrison County |
68839 |
65,631 |
3,208 |
4.89% |
Hartley County |
5382 |
6,062 |
-680 |
-11.22% |
Haskell County |
5416 |
5,899 |
-483 |
-8.19% |
Hays County |
241067 |
157,107 |
83,960 |
53.44% |
Hemphill County |
3382 |
3,807 |
-425 |
-11.16% |
Henderson County |
82150 |
78,532 |
3,618 |
4.61% |
Hidalgo County |
870781 |
774,769 |
96,012 |
12.39% |
Hill County |
35874 |
35,089 |
785 |
2.24% |
Hockley County |
21537 |
22,935 |
-1,398 |
-6.10% |
Hood County |
61598 |
51,182 |
10,416 |
20.35% |
Hopkins County |
36787 |
35,161 |
1,626 |
4.62% |
Houston County |
22066 |
23,732 |
-1,666 |
-7.02% |
Howard County |
34860 |
35,012 |
-152 |
-0.43% |
Hudspeth County |
3202 |
3,476 |
-274 |
-7.88% |
Hunt County |
99956 |
86,129 |
13,827 |
16.05% |
Hutchinson County |
20617 |
22,150 |
-1,533 |
-6.92% |
Irion County |
1513 |
1,599 |
-86 |
-5.38% |
Jack County |
8472 |
9,044 |
-572 |
-6.32% |
Jackson County |
14988 |
14,075 |
913 |
6.49% |
Jasper County |
32980 |
35,710 |
-2,730 |
-7.64% |
Jeff Davis County |
1996 |
2,342 |
-346 |
-14.77% |
Jefferson County |
256526 |
252,273 |
4,253 |
1.69% |
Jim Hogg County |
4838 |
5,300 |
-462 |
-8.72% |
Jim Wells County |
38891 |
40,838 |
-1,947 |
-4.77% |
Johnson County |
179927 |
150,934 |
28,993 |
19.21% |
Jones County |
19663 |
20,202 |
-539 |
-2.67% |
Karnes County |
14710 |
14,824 |
-114 |
-0.77% |
Kaufman County |
145310 |
103,350 |
41,960 |
40.60% |
Kendall County |
44279 |
33,410 |
10,869 |
32.53% |
Kenedy County |
350 |
416 |
-66 |
-15.87% |
Kent County |
753 |
808 |
-55 |
-6.81% |
Kerr County |
52598 |
49,625 |
2,973 |
5.99% |
Kimble County |
4286 |
4,607 |
-321 |
-6.97% |
King County |
265 |
286 |
-21 |
-7.34% |
Kinney County |
3129 |
3,598 |
-469 |
-13.04% |
Kleberg County |
31040 |
32,061 |
-1,021 |
-3.18% |
Knox County |
3353 |
3,719 |
-366 |
-9.84% |
Lamar County |
50088 |
49,793 |
295 |
0.59% |
Lamb County |
13045 |
13,977 |
-932 |
-6.67% |
Lampasas County |
21627 |
19,677 |
1,950 |
9.91% |
La Salle County |
6664 |
6,886 |
-222 |
-3.22% |
Lavaca County |
20337 |
19,263 |
1,074 |
5.58% |
Lee County |
17478 |
16,612 |
866 |
5.21% |
Leon County |
15719 |
16,801 |
-1,082 |
-6.44% |
Liberty County |
91628 |
75,643 |
15,985 |
21.13% |
Limestone County |
22146 |
23,384 |
-1,238 |
-5.29% |
Lipscomb County |
3059 |
3,302 |
-243 |
-7.36% |
Live Oak County |
11335 |
11,531 |
-196 |
-1.70% |
Llano County |
21243 |
19,301 |
1,942 |
10.06% |
Loving County |
64 |
82 |
-18 |
-21.95% |
Lubbock County |
310639 |
278,831 |
31,808 |
11.41% |
Lynn County |
5596 |
5,915 |
-319 |
-5.39% |
McCulloch County |
7630 |
8,283 |
-653 |
-7.88% |
McLennan County |
260579 |
234,906 |
25,673 |
10.93% |
McMullen County |
600 |
707 |
-107 |
-15.13% |
Madison County |
13455 |
13,664 |
-209 |
-1.53% |
Marion County |
9725 |
10,546 |
-821 |
-7.78% |
Martin County |
5237 |
4,799 |
438 |
9.13% |
Mason County |
3953 |
4,012 |
-59 |
-1.47% |
Matagorda County |
36255 |
36,702 |
-447 |
-1.22% |
Maverick County |
57887 |
54,258 |
3,629 |
6.69% |
Medina County |
50748 |
46,006 |
4,742 |
10.31% |
Menard County |
1962 |
2,242 |
-280 |
-12.49% |
Midland County |
169983 |
136,872 |
33,111 |
24.19% |
Milam County |
24754 |
24,757 |
-3 |
-0.01% |
Mills County |
4456 |
4,936 |
-480 |
-9.72% |
Mitchell County |
8990 |
9,403 |
-413 |
-4.39% |
Montague County |
19965 |
19,719 |
246 |
1.25% |
Montgomery County |
620443 |
455,746 |
164,697 |
36.14% |
Moore County |
21358 |
21,904 |
-546 |
-2.49% |
Morris County |
11973 |
12,934 |
-961 |
-7.43% |
Motley County |
1063 |
1,210 |
-147 |
-12.15% |
Nacogdoches County |
64653 |
64,524 |
129 |
0.20% |
Navarro County |
52624 |
47,735 |
4,889 |
10.24% |
Newton County |
12217 |
14,445 |
-2,228 |
-15.42% |
Nolan County |
14738 |
15,216 |
-478 |
-3.14% |
Nueces County |
353178 |
340,223 |
12,955 |
3.81% |
Ochiltree County |
10015 |
10,223 |
-208 |
-2.03% |
Oldham County |
1758 |
2,052 |
-294 |
-14.33% |
Orange County |
84808 |
81,837 |
2,971 |
3.63% |
Palo Pinto County |
28409 |
28,111 |
298 |
1.06% |
Panola County |
22491 |
23,796 |
-1,305 |
-5.48% |
Parker County |
148222 |
116,927 |
31,295 |
26.76% |
Parmer County |
9869 |
10,269 |
-400 |
-3.90% |
Pecos County |
15193 |
15,507 |
-314 |
-2.02% |
Polk County |
50123 |
45,413 |
4,710 |
10.37% |
Potter County |
118525 |
121,073 |
-2,548 |
-2.10% |
Presidio County |
6131 |
7,818 |
-1,687 |
-21.58% |
Rains County |
12164 |
10,914 |
1,250 |
11.45% |
Randall County |
140753 |
120,725 |
20,028 |
16.59% |
Reagan County |
3385 |
3,367 |
18 |
0.53% |
Real County |
2758 |
3,309 |
-551 |
-16.65% |
Red River County |
11587 |
12,860 |
-1,273 |
-9.90% |
Reeves County |
14748 |
13,783 |
965 |
7.00% |
Refugio County |
6741 |
7,383 |
-642 |
-8.70% |
Roberts County |
827 |
929 |
-102 |
-10.98% |
Robertson County |
16757 |
16,622 |
135 |
0.81% |
Rockwall County |
107819 |
78,337 |
29,482 |
37.63% |
Runnels County |
9900 |
10,501 |
-601 |
-5.72% |
Rusk County |
52214 |
53,330 |
-1,116 |
-2.09% |
Sabine County |
9894 |
10,834 |
-940 |
-8.68% |
San Augustine County |
7918 |
8,865 |
-947 |
-10.68% |
San Jacinto County |
27402 |
26,384 |
1,018 |
3.86% |
San Patricio County |
68755 |
64,804 |
3,951 |
6.10% |
San Saba County |
5730 |
6,131 |
-401 |
-6.54% |
Schleicher County |
2451 |
3,461 |
-1,010 |
-29.18% |
Scurry County |
16932 |
16,921 |
11 |
0.07% |
Shackelford County |
3105 |
3,378 |
-273 |
-8.08% |
Shelby County |
24022 |
25,448 |
-1,426 |
-5.60% |
Sherman County |
2782 |
3,034 |
-252 |
-8.31% |
Smith County |
233479 |
209,714 |
23,765 |
11.33% |
Somervell County |
9205 |
8,490 |
715 |
8.42% |
Starr County |
65920 |
60,968 |
4,952 |
8.12% |
Stephens County |
9101 |
9,630 |
-529 |
-5.49% |
Sterling County |
1372 |
1,143 |
229 |
20.03% |
Stonewall County |
1245 |
1,490 |
-245 |
-16.44% |
Sutton County |
3372 |
4,128 |
-756 |
-18.31% |
Swisher County |
6971 |
7,854 |
-883 |
-11.24% |
Tarrant County |
2110640 |
1,809,034 |
301,606 |
16.67% |
Taylor County |
143208 |
131,506 |
11,702 |
8.90% |
Terrell County |
760 |
984 |
-224 |
-22.76% |
Terry County |
11831 |
12,651 |
-820 |
-6.48% |
Throckmorton County |
1440 |
1,641 |
-201 |
-12.25% |
Titus County |
31247 |
32,334 |
-1,087 |
-3.36% |
Tom Green County |
120003 |
110,224 |
9,779 |
8.87% |
Travis County |
1290188 |
1,024,266 |
265,922 |
25.96% |
Trinity County |
13602 |
14,585 |
-983 |
-6.74% |
Tyler County |
19798 |
21,766 |
-1,968 |
-9.04% |
Upshur County |
40892 |
39,309 |
1,583 |
4.03% |
Upton County |
3308 |
3,355 |
-47 |
-1.40% |
Uvalde County |
24564 |
26,405 |
-1,841 |
-6.97% |
Val Verde County |
47586 |
48,879 |
-1,293 |
-2.65% |
Van Zandt County |
59541 |
52,579 |
6,962 |
13.24% |
Victoria County |
91319 |
86,793 |
4,526 |
5.21% |
Walker County |
76400 |
67,861 |
8,539 |
12.58% |
Waller County |
56794 |
43,205 |
13,589 |
31.45% |
Ward County |
11644 |
10,658 |
986 |
9.25% |
Washington County |
35805 |
33,718 |
2,087 |
6.19% |
Webb County |
267114 |
250,304 |
16,810 |
6.72% |
Wharton County |
41570 |
41,280 |
290 |
0.70% |
Wheeler County |
4990 |
5,410 |
-420 |
-7.76% |
Wichita County |
129350 |
131,500 |
-2,150 |
-1.63% |
Wilbarger County |
12887 |
13,535 |
-648 |
-4.79% |
Willacy County |
20164 |
22,134 |
-1,970 |
-8.90% |
Williamson County |
609017 |
422,679 |
186,338 |
44.08% |
Wilson County |
49753 |
42,918 |
6,835 |
15.93% |
Winkler County |
7791 |
7,110 |
681 |
9.58% |
Wise County |
68632 |
59,127 |
9,505 |
16.08% |
Wood County |
44843 |
41,964 |
2,879 |
6.86% |
Yoakum County |
7694 |
7,879 |
-185 |
-2.35% |
Young County |
17867 |
18,550 |
-683 |
-3.68% |
Zapata County |
13889 |
14,018 |
-129 |
-0.92% |
Zavala County |
9670 |
11,677 |
-2,007 |
-17.19% |
SOURCE: U.S. Bureau of the Census
Texas Population News Articles
Texas must invest in water to meet population growth, state demographer says – Feb 4, 2025
25-year study reveals impact, rate of Texas agriculture land sold for development – Feb 6, 2025
Texas adds more people than any other state for second consecutive year – Feb 8, 2025
Who are the undocumented immigrants in Texas? – Feb 17, 2025
Texans encouraged to ‘decarbonize’ buildings to fight climate change – Feb 28, 2025
Millions in Texas Asked to Avoid Using Their Car – Oct 29, 2024
Holding Out Hope On the Drying Rio Grande – Oct 23, 2024
Thousands of New Immigrants Are Settling in These Areas of Texas – Oct 22, 2024
Texas state policy reduces local power in pollution lawsuits – Oct 17, 2024
Texas’ order to ask hospital patients’ citizenship status renews focus on the state’s large uninsured population – Oct 17, 2024
Celina to break ground on new downtown center as population surges – Oct 14, 2024
Texas Population Set To Soar as Residents Flock to the Lone Star State From These Surprising Places – Aug 18, 2024
SpaceX repeatedly polluted waters in Texas this year, regulators found – Aug 13, 2024
Thirsty New Subdivisions Have Made the Texas Groundwater Crisis Plain to See – Aug 2024
Texas’ floating barrier in the Rio Grande can stay for now, appeals court says – July 30, 2024
Texas has nine out of 11 fastest growing cities in the nation – July 26, 2024
Texas considering expansion of passenger rail system amid state’s growing population – July 24, 2024
Migrant crossings fall sharply along Texas border, shifting to Arizona and California – Feb 8, 2024
Ag census shows Texas lost over 17,700 farms – Feb 21, 2024
Lives “devastated’ by petrochemical industry pollution in Texas: Report – Jan 26, 2024
Texas companies reported releasing 1 million pounds of excess pollution during recent cold snap – Jan 26, 2024
Another Hot, Dry Summer May Push Parts of Texas to the Brink – Jan 22, 2024
Texas’ population is projected to surpass 50M by 2070. Do we have enough water? – Jan 20, 2024
High migration through Texas border town of Eagle Pass strains resources – September 22, 2023
Texas just recorded its second hottest summer on record – September 7, 2023
KHOU 11 Investigates: All Houston-area beaches saw high fecal levels this year – August 31, 2023
Texas Joins California As State With 30-Million-Plus Population – August 29, 2023
It may take years for Texas rivers, lakes to recover from drought – August 29, 2023
Heat strains Texas power grid as population keeps growing – August 28, 2023
Texas Wants to Know: How does immigration impact the state’s economy? – September 9, 2023
It may take years for Texas rivers, lakes to recover from drought – August 29, 2023
Texas eighth graders will soon be required to learn about climate change. But not without a showdown over textbooks. – August 29, 2023
Heat strains Texas power grid as population keeps growing – August 28, 2023
Heat, drought and population growth have stressed aquifers that supply water to millions of Texans – August 16, 2023
Texas sues Shell over May fire at Houston-area petrochemical plant – August 15, 2023
Texas Weakens Climate Science Education Guidelines – Mar 16, 2023
Texas Highway Project Proceeds Despite Neighborhood Backlash – Mar 7, 2023
‘It’s a win-win’: Fort Worth will sell gas from your trash through new landfill program – Feb 25, 2023
Biden Urged to Reject Texas Oil Terminals That Could Create “Carbon Bombs” – Feb 24, 2023
As the Region Booms, Farmers Struggle to Feed Austin Locally – Feb 24, 2023
How 60-year-old weather data is flooding Texas with pollution – June 8, 2022
EPA, Total Port Arthur release statements following pollution concerns in Southeast Texas cities – June 2, 2022
New population estimates reveal fastest-growing cities in Texas – June 2, 2022
Texas drought strengthens its grip, triggering wildfires, water restrictions and crop disasters – May 25, 2022
Seven ways climate change is already hitting Texans – May 18, 2022
Earthquakes in Texas doubled in 2021. Scientists cite years of oil companies injecting sludgy water underground. – February 8, 2022
Thanks to Climate Change, Trees in Texas Are Legitimately Exploding – February 8, 2022
New study forecasts increased flooding in Texas due to climate change, population growth – February 8, 2022
Texas tenants hit with soaring rent increases see little relief in sight – February 4, 2022
‘It’s blown up really fast’ | Suburban growth helps shift Harris County’s center of population outside the Loop for the first time – January 18, 2022