
Tennessee
Click the links below to view state facts.
Tennessee Population News Articles
Population Density
Historic & Projected Growth
Population by County
POPULATION DENSITY
People per square mile, 2010: 153.9
People per square mile, 2020: 167.6
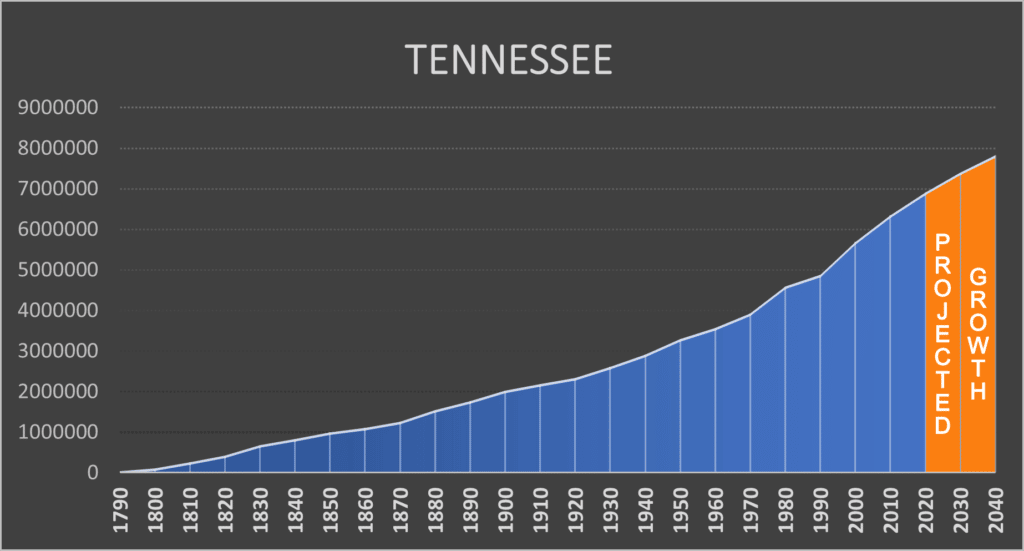
HISTORIC & PROJECTED GROWTH 1790 TO 2040
Year |
Population |
1790 |
35691 |
1800 |
105,602 |
1810 |
261,727 |
1820 |
422,823 |
1830 |
681,904 |
1840 |
829,210 |
1850 |
1,002,717 |
1860 |
1,109,801 |
1870 |
1,258,520 |
1880 |
1,542,359 |
1890 |
1,767,518 |
1900 |
2,020,616 |
1910 |
2,184,789 |
1920 |
2,337,885 |
1930 |
2,616,556 |
1940 |
2,915,841 |
1950 |
3,291,718 |
1960 |
3,567,089 |
1970 |
3,926,018 |
1980 |
4,591,023 |
1990 |
4,877,185 |
2000 |
5,689,283 |
2010 |
6,346,105 |
2020 |
6,910,840 |
2030 |
7,395,106 |
2040 |
7,823,662 |
SOURCE: U.S. Bureau of the Census & Weldon Cooper Center, Demographics Research Group
(The Census Bureau and Weldon Cooper Center have not yet provided updated State projections to reflect 2020 census numbers.)
Population by County
Census 2020 Population |
Census 2010 Population |
Change from 2000 |
Percent Change |
|
TENNESSEE |
6,910,840 |
6,346,105 |
564,735 |
8.90% |
Anderson County |
77,123 |
75,129 |
1,994 |
2.65% |
Bedford County |
50,237 |
45,058 |
5,179 |
11.49% |
Benton County |
15,864 |
16,489 |
-625 |
-3.79% |
Bledsoe County |
14,913 |
12,876 |
2,037 |
15.82% |
Blount County |
135,280 |
123,010 |
12,270 |
9.97% |
Bradley County |
108,620 |
98,963 |
9,657 |
9.76% |
Campbell County |
39,272 |
40,716 |
-1,444 |
-3.55% |
Cannon County |
14,506 |
13,801 |
705 |
5.11% |
Carroll County |
28,440 |
28,522 |
-82 |
-0.29% |
Carter County |
56,356 |
57,424 |
-1,068 |
-1.86% |
Cheatham County |
41,072 |
39,105 |
1,967 |
5.03% |
Chester County |
17,341 |
17,131 |
210 |
1.23% |
Claiborne County |
32,043 |
32,213 |
-170 |
-0.53% |
Clay County |
7,581 |
7,861 |
-280 |
-3.56% |
Cocke County |
35,999 |
35,662 |
337 |
0.94% |
Coffee County |
57,889 |
52,796 |
5,093 |
9.65% |
Crockett County |
13,911 |
14,586 |
-675 |
-4.63% |
Cumberland County |
61,145 |
56,053 |
5,092 |
9.08% |
Davidson County |
715,884 |
626,681 |
89,203 |
14.23% |
Decatur County |
11,435 |
11,757 |
-322 |
-2.74% |
DeKalb County |
20,080 |
18,723 |
1,357 |
7.25% |
Dickson County |
54,315 |
49,666 |
4,649 |
9.36% |
Dyer County |
36,801 |
38,335 |
-1,534 |
-4.00% |
Fayette County |
41,990 |
38,413 |
3,577 |
9.31% |
Fentress County |
18,489 |
17,959 |
530 |
2.95% |
Franklin County |
42,774 |
41,052 |
1,722 |
4.19% |
Gibson County |
50,429 |
49,683 |
746 |
1.50% |
Giles County |
30,346 |
29,485 |
861 |
2.92% |
Grainger County |
23,527 |
22,657 |
870 |
3.84% |
Greene County |
70,152 |
68,831 |
1,321 |
1.92% |
Grundy County |
13,529 |
13,703 |
-174 |
-1.27% |
Hamblen County |
64,499 |
62,544 |
1,955 |
3.13% |
Hamilton County |
366,207 |
336,463 |
29,744 |
8.84% |
Hancock County |
6,662 |
6,819 |
-157 |
-2.30% |
Hardeman County |
25,462 |
27,253 |
-1,791 |
-6.57% |
Hardin County |
26,831 |
26,026 |
805 |
3.09% |
Hawkins County |
56,721 |
56,833 |
-112 |
-0.20% |
Haywood County |
17,864 |
18,787 |
-923 |
-4.91% |
Henderson County |
27,842 |
27,769 |
73 |
0.26% |
Henry County |
32,199 |
32,330 |
-131 |
-0.41% |
Hickman County |
24,925 |
24,690 |
235 |
0.95% |
Houston County |
8,283 |
8,426 |
-143 |
-1.70% |
Humphreys County |
18,990 |
18,538 |
452 |
2.44% |
Jackson County |
11,617 |
11,638 |
-21 |
-0.18% |
Jefferson County |
54,683 |
51,407 |
3,276 |
6.37% |
Johnson County |
17,948 |
18,244 |
-296 |
-1.62% |
Knox County |
478,971 |
432,226 |
46,745 |
10.81% |
Lake County |
7,005 |
7,832 |
-827 |
-10.56% |
Lauderdale County |
25,143 |
27,815 |
-2,672 |
-9.61% |
Lawrence County |
44,159 |
41,869 |
2,290 |
5.47% |
Lewis County |
12,582 |
12,161 |
421 |
3.46% |
Lincoln County |
35,319 |
33,361 |
1,958 |
5.87% |
Loudon County |
54,886 |
48,556 |
6,330 |
13.04% |
McMinn County |
53,276 |
52,266 |
1,010 |
1.93% |
McNairy County |
25,866 |
26,075 |
-209 |
-0.80% |
Macon County |
25,216 |
22,248 |
2,968 |
13.34% |
Madison County |
98,823 |
98,294 |
529 |
0.54% |
Marion County |
28,837 |
28,237 |
600 |
2.12% |
Marshall County |
34,318 |
30,617 |
3,701 |
12.09% |
Maury County |
100,974 |
80,956 |
20,018 |
24.73% |
Meigs County |
12,758 |
11,753 |
1,005 |
8.55% |
Monroe County |
46,250 |
44,519 |
1,731 |
3.89% |
Montgomery County |
220,069 |
172,331 |
47,738 |
27.70% |
Moore County |
6,461 |
6,362 |
99 |
1.56% |
Morgan County |
21,035 |
21,987 |
-952 |
-4.33% |
Obion County |
30,787 |
31,807 |
-1,020 |
-3.21% |
Overton County |
22,511 |
22,083 |
428 |
1.94% |
Perry County |
8,366 |
7,915 |
451 |
5.70% |
Pickett County |
5,001 |
5,077 |
-76 |
-1.50% |
Polk County |
17,544 |
16,825 |
719 |
4.27% |
Putnam County |
79,854 |
72,321 |
7,533 |
10.42% |
Rhea County |
32,870 |
31,809 |
1,061 |
3.34% |
Roane County |
53,404 |
54,181 |
-777 |
-1.43% |
Robertson County |
72,803 |
66,283 |
6,520 |
9.84% |
Rutherford County |
341,486 |
262,604 |
78,882 |
30.04% |
Scott County |
21,850 |
22,228 |
-378 |
-1.70% |
Sequatchie County |
15,826 |
14,112 |
1,714 |
12.15% |
Sevier County |
98,380 |
89,889 |
8,491 |
9.45% |
Shelby County |
929,744 |
927,644 |
2,100 |
0.23% |
Smith County |
19,904 |
19,166 |
738 |
3.85% |
Stewart County |
13,657 |
13,324 |
333 |
2.50% |
Sullivan County |
158,163 |
156,823 |
1,340 |
0.85% |
Sumner County |
196,281 |
160,645 |
35,636 |
22.18% |
Tipton County |
60,970 |
61,081 |
-111 |
-0.18% |
Trousdale County |
11,615 |
7,870 |
3,745 |
47.59% |
Unicoi County |
17,928 |
18,313 |
-385 |
-2.10% |
Union County |
19,802 |
19,109 |
693 |
3.63% |
Van Buren County |
6,168 |
5,548 |
620 |
11.18% |
Warren County |
40,953 |
39,839 |
1,114 |
2.80% |
Washington County |
133,001 |
122,979 |
10,022 |
8.15% |
Wayne County |
16,232 |
17,021 |
-789 |
-4.64% |
Weakley County |
32,902 |
35,021 |
-2,119 |
-6.05% |
White County |
27,351 |
25,841 |
1,510 |
5.84% |
Williamson County |
247,726 |
183,182 |
64,544 |
35.23% |
Wilson County |
147,737 |
113,993 |
33,744 |
29.60% |
SOURCE: U.S. Bureau of the Census
Tennessee Population News Articles
Nashville suburb enjoys continued growth as state’s job market strengthens – Nov 1, 2024
Counties with the worst droughts in Tennessee – Oct 28, 2024
Lawsuit Challenges TVA Plan to Build Methane Gas Plant at Site of Massive Tennessee Industrial Spill – Oct 10, 2024
Elon Musk’s xAI accused of worsening Memphis smog with unauthorized gas turbines at data center – Aug 28, 2024
Tennessee Population Projected To Hit Nearly 8 Million by 2040 – Aug 27, 2024
Tennessee offers driver tests in only five languages. This group is trying to change that – Aug 15, 2024
East Tennessee population boom prompting action from utility districts – Aug 14, 2024
PFAS-contaminated sewage sludge is spreading across Tennessee lands. The state might intervene. – Aug 14, 2024
Tennessee officials are worried about wetlands. Here’s why. – Aug 9, 2024
Climate Change Action Moves Ahead Across Tennessee – Mar 1, 2024
Sierra Club Testing Finds High Levels of ‘Forever’ Chemicals in Water in NE Tennessee – Mar 1, 2024
States sending the most people to Tennessee – Feb 22, 2024
Wetlands have some protections in Tennessee. The state legislature might remove them. – Feb 19, 2024
New efforts underway to address major shortage of health care workers in Tennessee – Feb 5, 2024
Hundreds of immigrants eye Middle Tennessee for relocation, stirring local concern – Feb 5, 2024
Just-Released Data: Foreign-Born Population Above 46 million in July 2022 – September 22, 2023
Homes in Gallatin being built too fast, councilman says – September 21, 2023
Future Tennessee State Parks – September 13, 2023
Tennessee reaches settlement over Dickson County waterway pollution. Here’s what it means. – September 7, 2023
Discover the 3 Largest Cities in Tennessee – September 5, 2023
Census shows Clarksville leading growth in Tennessee, 5th overall – June 7, 2023
New Area Code to be Added to East Tennessee – June 5, 2023
KAAR: First-time homebuyers and disadvantaged groups in East TN seeing fewer options as housing becomes ‘increasingly unaffordable’ – May 22, 2023
Tennessee now has more than 7 million residents – May 15, 2023
Nashville rainstorms are getting wetter. How much? 12% wetter in the past five decades. – May 16, 2023
Fishing advisory issued for six different Tennessee counties – June 20, 2022
EPA offering grants to rural Tennessee counties to run new, ‘clean’ school buses – June 13, 2022
TN flood insurance to increase by up to $100 per month – June 6, 2022
Spring Hill, Tennessee one of 10 fastest-growing cities in the U.S. according to new Census numbers – May 26, 2022
Census undercounted TN’s population – May 24, 2022
From uranium to dry cleaner chemicals, Tennessee has lots of legacy pollution. A $40M grant might erase some of it. – February 11, 2022
HOW FLOODING AFFECTS TENNESSEE – February 8, 2022
Fastest growing cities in Tennessee – February 7, 2022
Mayor: Nashville bringing ‘sense of urgency’ to reduce its carbon footprint – February 2, 2022
Severe weather events here to stay in Tennessee thanks to climate change – January 19, 2022
Memphis residents wage fight against TVA coal ash storage – November 15, 2021
Flash floods: How climate change has affected Tennessee – November 11, 2021
Around 700 more people living on the street in Knoxville over last 3 months – November 4, 2021
Robertson County town fighting against a 700-home neighborhood as growth outpaces infrastructure – November 1, 2021
How did the Middle Tennessee flooding downpour fall so fast? – August 23, 2021
The Floods In Tennessee Aren’t Freak Accidents. They’re A New Reality – August 23, 2021
Tennessee’s 10 Biggest Climate Polluters – August 16, 2021
TVA demolishes much of state’s oldest coal-fired plant in move to cleaner energy – Jul 31, 2021
Report: Tennessee sees 31.5% increase in construction spending since COVID – June 4, 2021
Tennessee Is Experiencing the 10th Most Forest Growth – June 3, 2021
Report: $126M price tag for cleaning up Tennessee’s abandoned coal fields – May 19, 2021
Farmers feel strain of changing weather in East Tennessee, with more rain on average – May 19, 2021
Rutherford County Population Growth = One of the Fastest Growing TN Counties – May 10, 2021
Renaissance Park’s wetland helps improve water quality – February 12, 2021
Report: Tennessee needs $58B for infrastructure improvements – January 27, 2021
More People Moved to Tennessee in 2020 Than Any Other State, According to a New Report – January 21, 2021