
North Carolina
Click the links below to view state facts.
Population News Articles
Population Density
Historic & Projected Growth
Population by County
POPULATION DENSITY
People per square mile, 2010: 196.1
People per square mile, 2020: 214.7
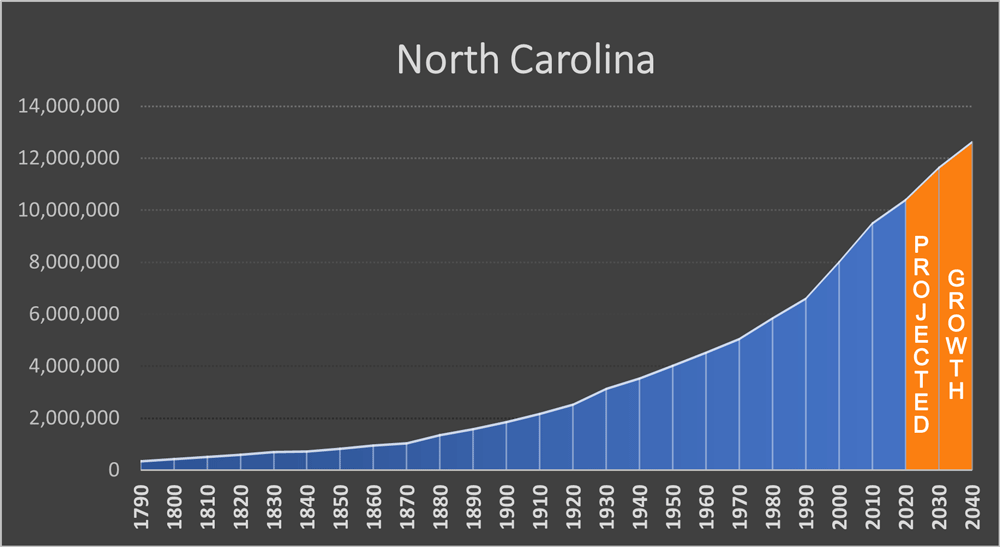
HISTORIC & PROJECTED GROWTH 1790 TO 2040
Year |
Population |
1790 |
393,751 |
1800 |
478,103 |
1810 |
555,500 |
1820 |
638,829 |
1830 |
737,987 |
1840 |
753,419 |
1850 |
869,039 |
1860 |
992,622 |
1870 |
1,071,361 |
1880 |
1,399,750 |
1890 |
1,617,949 |
1900 |
1,893,810 |
1910 |
2,206,287 |
1920 |
2,559,123 |
1930 |
3,170,276 |
1940 |
3,571,623 |
1950 |
4,061,929 |
1960 |
4,556,155 |
1970 |
5,084,411 |
1980 |
5,880,095 |
1990 |
6,628,637 |
2000 |
8,049,313 |
2010 |
9,535,483 |
2020 |
10,439,388 |
2030 |
11,609,883 |
2040 |
12,658,927 |
SOURCE: U.S. Bureau of the Census & Weldon Cooper Center, Demographics Research Group
(The Census Bureau and Weldon Cooper Center have not yet provided updated State projections to reflect 2020 census numbers.)
Population by County
Census 2020 Population |
Census 2010 Population |
Change from 2020 |
Percent Change |
|
NORTH CAROLINA |
10,439,388 |
9,535,483 |
903,905 |
9.48% |
Alamance County |
171415 |
151,131 |
20,284 |
13.42% |
Alexander County |
36444 |
37,198 |
-754 |
-2.03% |
Alleghany County |
10888 |
11,155 |
-267 |
-2.39% |
Anson County |
22055 |
26,948 |
-4,893 |
-18.16% |
Ashe County |
26577 |
27,281 |
-704 |
-2.58% |
Avery County |
17806 |
17,797 |
9 |
0.05% |
Beaufort County |
44652 |
47,759 |
-3,107 |
-6.51% |
Bertie County |
17934 |
21,282 |
-3,348 |
-15.73% |
Bladen County |
29606 |
35,190 |
-5,584 |
-15.87% |
Brunswick County |
136693 |
107,431 |
29,262 |
27.24% |
Buncombe County |
269452 |
238,318 |
31,134 |
13.06% |
Burke County |
87570 |
90,912 |
-3,342 |
-3.68% |
Cabarrus County |
225804 |
178,011 |
47,793 |
26.85% |
Caldwell County |
80652 |
83,029 |
-2,377 |
-2.86% |
Camden County |
10355 |
9,980 |
375 |
3.76% |
Carteret County |
67686 |
66,469 |
1,217 |
1.83% |
Caswell County |
22736 |
23,719 |
-983 |
-4.14% |
Catawba County |
160610 |
154,358 |
6,252 |
4.05% |
Chatham County |
76285 |
63,505 |
12,780 |
20.12% |
Cherokee County |
28774 |
27,444 |
1,330 |
4.85% |
Chowan County |
13708 |
14,793 |
-1,085 |
-7.33% |
Clay County |
11089 |
10,587 |
502 |
4.74% |
Cleveland County |
99519 |
98,078 |
1,441 |
1.47% |
Columbus County |
50623 |
58,098 |
-7,475 |
-12.87% |
Craven County |
100720 |
103,505 |
-2,785 |
-2.69% |
Cumberland County |
334728 |
319,431 |
15,297 |
4.79% |
Currituck County |
28100 |
23,547 |
4,553 |
19.34% |
Dare County |
36915 |
33,920 |
2,995 |
8.83% |
Davidson County |
168930 |
162,878 |
6,052 |
3.72% |
Davie County |
42712 |
41,240 |
1,472 |
3.57% |
Duplin County |
48715 |
58,505 |
-9,790 |
-16.73% |
Durham County |
324833 |
267,587 |
57,246 |
21.39% |
Edgecombe County |
48900 |
56,552 |
-7,652 |
-13.53% |
Forsyth County |
382590 |
350,670 |
31,920 |
9.10% |
Franklin County |
68573 |
60,619 |
7,954 |
13.12% |
Gaston County |
227943 |
206,086 |
21,857 |
10.61% |
Gates County |
10478 |
12,197 |
-1,719 |
-14.09% |
Graham County |
8030 |
8,861 |
-831 |
-9.38% |
Granville County |
60992 |
59,916 |
1,076 |
1.80% |
Greene County |
20451 |
21,362 |
-911 |
-4.26% |
Guilford County |
541299 |
488,406 |
52,893 |
10.83% |
Halifax County |
48622 |
54,691 |
-6,069 |
-11.10% |
Harnett County |
133568 |
114,678 |
18,890 |
16.47% |
Haywood County |
62089 |
59,036 |
3,053 |
5.17% |
Henderson County |
116281 |
106,740 |
9,541 |
8.94% |
Hertford County |
21552 |
24,669 |
-3,117 |
-12.64% |
Hoke County |
52082 |
46,952 |
5,130 |
10.93% |
Hyde County |
4589 |
5,810 |
-1,221 |
-21.02% |
Iredell County |
186693 |
159,437 |
27,256 |
17.10% |
Jackson County |
43109 |
40,271 |
2,838 |
7.05% |
Johnston County |
215999 |
168,878 |
47,121 |
27.90% |
Jones County |
9172 |
10,153 |
-981 |
-9.66% |
Lee County |
63285 |
57,866 |
5,419 |
9.36% |
Lenoir County |
55122 |
59,495 |
-4,373 |
-7.35% |
Lincoln County |
86810 |
78,265 |
8,545 |
10.92% |
McDowell County |
44578 |
44,996 |
-418 |
-0.93% |
Macon County |
37014 |
33,922 |
3,092 |
9.12% |
Madison County |
21193 |
20,764 |
429 |
2.07% |
Martin County |
22031 |
24,505 |
-2,474 |
-10.10% |
Mecklenburg County |
1115482 |
919,628 |
195,854 |
21.30% |
Mitchell County |
14903 |
15,579 |
-676 |
-4.34% |
Montgomery County |
25751 |
27,798 |
-2,047 |
-7.36% |
Moore County |
99727 |
88,247 |
11,480 |
13.01% |
Nash County |
94970 |
95,840 |
-870 |
-0.91% |
New Hanover County |
225702 |
202,667 |
23,035 |
11.37% |
Northampton County |
17471 |
22,099 |
-4,628 |
-20.94% |
Onslow County |
204576 |
177,772 |
26,804 |
15.08% |
Orange County |
148696 |
133,801 |
14,895 |
11.13% |
Pamlico County |
12276 |
13,144 |
-868 |
-6.60% |
Pasquotank County |
40568 |
40,661 |
-93 |
-0.23% |
Pender County |
60203 |
52,217 |
7,986 |
15.29% |
Perquimans County |
13005 |
13,453 |
-448 |
-3.33% |
Person County |
39097 |
39,464 |
-367 |
-0.93% |
Pitt County |
170243 |
168,148 |
2,095 |
1.25% |
Polk County |
19328 |
20,510 |
-1,182 |
-5.76% |
Randolph County |
144171 |
141,752 |
2,419 |
1.71% |
Richmond County |
42946 |
46,639 |
-3,693 |
-7.92% |
Robeson County |
116530 |
134,168 |
-17,638 |
-13.15% |
Rockingham County |
91096 |
93,643 |
-2,547 |
-2.72% |
Rowan County |
146875 |
138,428 |
8,447 |
6.10% |
Rutherford County |
64444 |
67,810 |
-3,366 |
-4.96% |
Sampson County |
59036 |
63,431 |
-4,395 |
-6.93% |
Scotland County |
34174 |
36,157 |
-1,983 |
-5.48% |
Stanly County |
62504 |
60,585 |
1,919 |
3.17% |
Stokes County |
44520 |
47,401 |
-2,881 |
-6.08% |
Surry County |
71359 |
73,673 |
-2,314 |
-3.14% |
Swain County |
14117 |
13,981 |
136 |
0.97% |
Transylvania County |
32986 |
33,090 |
-104 |
-0.31% |
Tyrrell County |
3245 |
4,407 |
-1,162 |
-26.37% |
Union County |
238267 |
201,292 |
36,975 |
18.37% |
Vance County |
42578 |
45,422 |
-2,844 |
-6.26% |
Wake County |
1129410 |
900,993 |
228,417 |
25.35% |
Warren County |
18642 |
20,972 |
-2,330 |
-11.11% |
Washington County |
11003 |
13,228 |
-2,225 |
-16.82% |
Watauga County |
54086 |
51,079 |
3,007 |
5.89% |
Wayne County |
117333 |
122,623 |
-5,290 |
-4.31% |
Wilkes County |
65969 |
69,340 |
-3,371 |
-4.86% |
Wilson County |
78784 |
81,234 |
-2,450 |
-3.02% |
Yadkin County |
37214 |
38,406 |
-1,192 |
-3.10% |
Yancey County |
18470 |
17,818 |
652 |
3.66% |
SOURCE: U.S. Bureau of the Census
North Carolina Population News Articles
Aqua North Carolina installs 7 PFAS treatment systems to protect drinking water – Jan 31, 2025
North Carolina launches Energy Saver NC program with $208 million in rebates – Jan 16, 2025
EPA steps in, demands action on toxic chemical in NC drinking water – Jan 14, 2025
North Carolina’s population growth continues around its cities – Jan 7, 2025
New Duke Energy gas plants move forward in North Carolina despite residents’ concerns – Jan 6, 2025
North Carolina’s foreign-born population is booming – Oct 20, 2024
Hurricanes leave behind long-term health risks and water contamination – Oct 16, 2024
Holly Ridge population growing rapidly – Oct 14, 2024
Why was Asheville, North Carolina flooding so bad? Rare weather events and climate change are to blame – Oct 2, 2024
Hurricane Helene Lays Bare the Growing Threat of Inland Flooding – Oct 1, 2024
Park Air Profiles – Great Smoky Mountains National Park – Sept 23, 2024
‘What nature intended it to be’: NC lands historic EPA grant to fight climate change – July 25, 2024
18.0% of North Carolina Rivers Are Too Polluted for Swimming – July 19, 2024
Severe drought covers a quarter of NC counties amid record-breaking heat – July 16, 2024
Where refugees in North Carolina are arriving from -July 11, 2024
This North Carolina town’s population has grown 46% in the last year – July 11, 2024
IRS data shows migration to North Carolina in droves – July 4, 2024
NC inpatient psychiatric beds not keeping pace with population growth – Jan 25, 2024
Researchers say wildfires in NC will likely only get worse. Here’s why – Jan 24, 2024
A decades-long battle against North Carolina’s largest landfill is ramping up – Jan 19, 2024
Population growth spurs Bartlett mill expansion – Jan 15, 2024
Domestic migration fuels North Carolina’s swelling population – Jan 5, 2024
Coastal crossroads: NC’s growing risk of Maui-like wildfires – August 16, 2023
EPA Denies Factory Farm Water Pollution Petition – August 15, 2023
NC school enrollment trends raise big questions about the future – August 8, 2023
Discover the 5 Fastest-Shrinking Counties in North Carolina – July 28, 2023
High percentage of federal police funding supplied to sanctuary jurisdictions – July 27, 2023
How North Carolina’s Carbon Emissions Compare to Other States – July 26, 2023
Raleigh ranks 9th in the nation for apartment shortages – August 28, 2022
North Carolina temperatures will feel like 125°F by 2053, study shows – August 17, 2022
NC pellet plant wants to expand, but some worry about emissions – August 15, 2022
Beachgoers beware: Climate change may be increasing fecal bacteria at North Carolina beaches – August 5, 2022
Here’s How Much the Population Grew in Wilmington, NC During the Pandemic – April 27, 2022
North Carolina faces shortage of 900,000 housing units by 2030, exec warns – April 29, 2022
Buncombe’s unsheltered homeless population doubles in a year – May 12, 2022
Plan would fund clean energy, hog farm buyouts, resilience – May 18, 2022
Beach house washed away by Atlantic Ocean sparks Zillow and climate change chatter – May 11, 2022
N.C. governor’s climate order marks a turning point on transportation – January 20, 2022
17% of people live near toxic release facilities. Here’s how it breaks down in North Carolina – January 11, 2022
PFAS, Climate Change, Mining, and Hazardous Waste: 2022 Will Be Another Critical Year for the Environment in North Carolina – January 6, 2022
Hog farming has a massive poop problem – January 4, 2022
Along the NC coast, the Cape Lookout National Seashore is embracing its dark side – December 23, 2021
Climate change: North Carolina gov signs major energy law – October 13, 2021
How Habitat Protection Can Help North Carolina’s Coastal Communities, Fish, and Ecosystems – October 12, 2021
New air pollution report points to health problems in the mountains – October 5, 2021
Winston-Salem population is just shy of 250,000 in the 2020 Census, but city is more diverse – October 2, 2021
See how much of North Carolina is experiencing drought conditions – September 26, 2021
The oldest tree in eastern US survived millennia – but rising seas could kill it – August 1, 2021
This Is The Fastest Growing City In North Carolina – July 25, 2021
Environmental groups encourage action to improve coastal water quality – July 15, 2021
‘It’s just not getting better’: North Carolina riverkeepers cry foul over state’s farm law – July 11, 2021
Report: Charlotte’s Air Quality is the Worst in the Southeast – April 21, 2021
How North Carolina is already seeing the impact of climate change – April 15, 2021
Shortfalls in North Carolina’s infrastructure threaten future – April 13, 2021
How a shortage of doctors impacts medical care in North Carolina’s rural areas – April 12, 2021
Record warm & record wet: 2020 in North Carolina shows signs of climate change – January 15, 2020
Groups call on NC to adopt a price on carbon, join compact to reduce emissions – January 14, 2021