
Missouri
Click the links below to view state facts.
Missouri Population News Articles
Population Density
Historic & Projected Growth
Population by County
POPULATION DENSITY
People per square mile, 2010: 87.1
People per square mile, 2020: 89.5
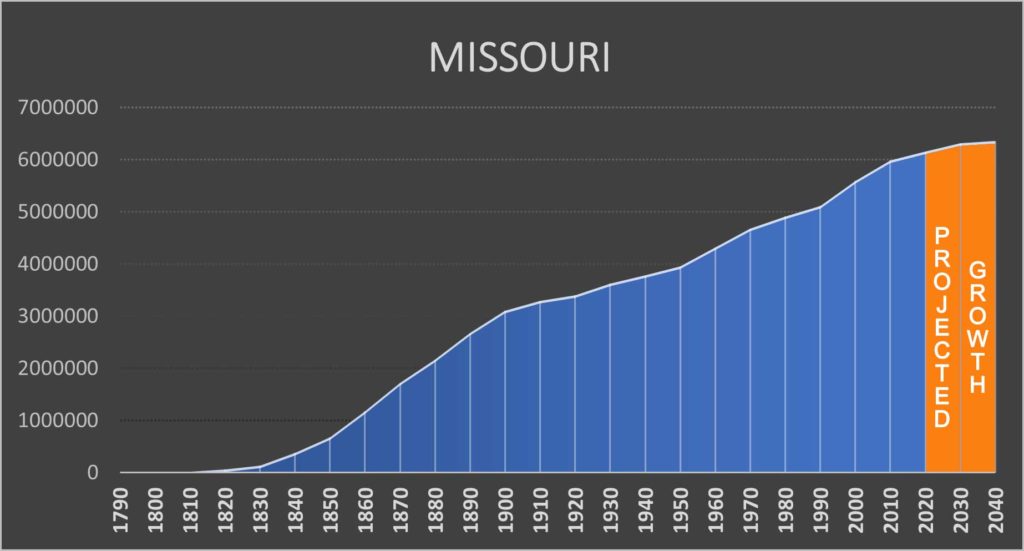
HISTORIC & PROJECTED GROWTH 1790 TO 2040
Year |
Population |
1790 |
0 |
1800 |
0 |
1810 |
19,783 |
1820 |
66,586 |
1830 |
140,455 |
1840 |
383,702 |
1850 |
682,044 |
1860 |
1,182,012 |
1870 |
1,721,295 |
1880 |
2,168,380 |
1890 |
2,679,185 |
1900 |
3,106,665 |
1910 |
3,293,335 |
1920 |
3,404,055 |
1930 |
3,629,367 |
1940 |
3,784,664 |
1950 |
3,954,653 |
1960 |
4,319,813 |
1970 |
4,677,623 |
1980 |
4,916,766 |
1990 |
5,117,073 |
2000 |
5,595,211 |
2010 |
5,988,927 |
2020 |
6,154,913 |
2030 |
6,318,126 |
2040 |
6,359,970 |
SOURCE: U.S. Bureau of the Census & Weldon Cooper Center, Demographics Research Group
(The Census Bureau and Weldon Cooper Center have not yet provided updated State projections to reflect 2020 census numbers.)
Population by County
Population By County |
Census 2020 Population |
Census 2010 Population |
Change from 2020 |
Percent Change |
MISSOURI |
6,154,913 |
5,988,927 |
165,986 |
2.77% |
Adair County |
25,314 |
25,607 |
-293 |
-1.14% |
Andrew County |
18,135 |
17,291 |
844 |
4.88% |
Atchison County |
5,305 |
5,685 |
-380 |
-6.68% |
Audrain County |
24,962 |
25,529 |
-567 |
-2.22% |
Barry County |
34,534 |
35,597 |
-1,063 |
-2.99% |
Barton County |
11,637 |
12,402 |
-765 |
-6.17% |
Bates County |
16,042 |
17,049 |
-1,007 |
-5.91% |
Benton County |
19,394 |
19,056 |
338 |
1.77% |
Bollinger County |
10,567 |
12,363 |
-1,796 |
-14.53% |
Boone County |
183,610 |
162,642 |
20,968 |
12.89% |
Buchanan County |
84,793 |
89,201 |
-4,408 |
-4.94% |
Butler County |
42,130 |
42,794 |
-664 |
-1.55% |
Caldwell County |
8,815 |
9,424 |
-609 |
-6.46% |
Callaway County |
44,283 |
44,332 |
-49 |
-0.11% |
Camden County |
42,745 |
44,002 |
-1,257 |
-2.86% |
Cape Girardeau County |
81,710 |
75,674 |
6,036 |
7.98% |
Carroll County |
8,495 |
9,295 |
-800 |
-8.61% |
Carter County |
5,202 |
6,265 |
-1,063 |
-16.97% |
Cass County |
107,824 |
99,478 |
8,346 |
8.39% |
Cedar County |
14,188 |
13,982 |
206 |
1.47% |
Chariton County |
7,408 |
7,831 |
-423 |
-5.40% |
Christian County |
88,842 |
77,422 |
11,420 |
14.75% |
Clark County |
6,634 |
7,139 |
-505 |
-7.07% |
Clay County |
253,335 |
221,939 |
31,396 |
14.15% |
Clinton County |
21,184 |
20,743 |
441 |
2.13% |
Cole County |
77,279 |
75,990 |
1,289 |
1.70% |
Cooper County |
17,103 |
17,601 |
-498 |
-2.83% |
Crawford County |
23,056 |
24,696 |
-1,640 |
-6.64% |
Dade County |
7,569 |
7,883 |
-314 |
-3.98% |
Dallas County |
17,071 |
16,777 |
294 |
1.75% |
Daviess County |
8,430 |
8,433 |
-3 |
-0.04% |
DeKalb County |
11,029 |
12,892 |
-1,863 |
-14.45% |
Dent County |
14,421 |
15,657 |
-1,236 |
-7.89% |
Douglas County |
11,578 |
13,684 |
-2,106 |
-15.39% |
Dunklin County |
28,283 |
31,953 |
-3,670 |
-11.49% |
Franklin County |
104,682 |
101,492 |
3,190 |
3.14% |
Gasconade County |
14,794 |
15,222 |
-428 |
-2.81% |
Gentry County |
6,162 |
6,738 |
-576 |
-8.55% |
Greene County |
298,915 |
275,174 |
23,741 |
8.63% |
Grundy County |
9,808 |
10,261 |
-453 |
-4.41% |
Harrison County |
8,157 |
8,957 |
-800 |
-8.93% |
Henry County |
21,946 |
22,272 |
-326 |
-1.46% |
Hickory County |
8,279 |
9,627 |
-1,348 |
-14.00% |
Holt County |
4,223 |
4,912 |
-689 |
-14.03% |
Howard County |
10,151 |
10,144 |
7 |
0.07% |
Howell County |
39,750 |
40,400 |
-650 |
-1.61% |
Iron County |
9,537 |
10,630 |
-1,093 |
-10.28% |
Jackson County |
717,204 |
674,158 |
43,046 |
6.39% |
Jasper County |
122,761 |
117,404 |
5,357 |
4.56% |
Jefferson County |
226,739 |
218,733 |
8,006 |
3.66% |
Johnson County |
54,013 |
52,595 |
1,418 |
2.70% |
Knox County |
3,744 |
4,131 |
-387 |
-9.37% |
Laclede County |
36,039 |
35,571 |
468 |
1.32% |
Lafayette County |
32,984 |
33,381 |
-397 |
-1.19% |
Lawrence County |
38,001 |
38,634 |
-633 |
-1.64% |
Lewis County |
10,032 |
10,211 |
-179 |
-1.75% |
Lincoln County |
59,574 |
52,566 |
7,008 |
13.33% |
Linn County |
11,874 |
12,761 |
-887 |
-6.95% |
Livingston County |
14,557 |
15,195 |
-638 |
-4.20% |
McDonald County |
23,303 |
23,083 |
220 |
0.95% |
Macon County |
15,209 |
15,566 |
-357 |
-2.29% |
Madison County |
12,626 |
12,226 |
400 |
3.27% |
Maries County |
8,432 |
9,176 |
-744 |
-8.11% |
Marion County |
28,525 |
28,781 |
-256 |
-0.89% |
Mercer County |
3,538 |
3,785 |
-247 |
-6.53% |
Miller County |
24,722 |
24,748 |
-26 |
-0.11% |
Mississippi County |
12,577 |
14,358 |
-1,781 |
-12.40% |
Moniteau County |
15,473 |
15,607 |
-134 |
-0.86% |
Monroe County |
8,666 |
8,840 |
-174 |
-1.97% |
Montgomery County |
11,322 |
12,236 |
-914 |
-7.47% |
Morgan County |
21,006 |
20,565 |
441 |
2.14% |
New Madrid County |
16,434 |
18,956 |
-2,522 |
-13.30% |
Newton County |
58,648 |
58,114 |
534 |
0.92% |
Nodaway County |
21,241 |
23,370 |
-2,129 |
-9.11% |
Oregon County |
8,635 |
10,881 |
-2,246 |
-20.64% |
Osage County |
13,274 |
13,878 |
-604 |
-4.35% |
Ozark County |
8,553 |
9,723 |
-1,170 |
-12.03% |
Pemiscot County |
15,661 |
18,296 |
-2,635 |
-14.40% |
Perry County |
18,956 |
18,971 |
-15 |
-0.08% |
Pettis County |
42,980 |
42,201 |
779 |
1.85% |
Phelps County |
44,638 |
45,156 |
-518 |
-1.15% |
Pike County |
17,587 |
18,516 |
-929 |
-5.02% |
Platte County |
106,718 |
89,322 |
17,396 |
19.48% |
Polk County |
31,519 |
31,137 |
382 |
1.23% |
Pulaski County |
53,955 |
52,274 |
1,681 |
3.22% |
Putnam County |
4,681 |
4,979 |
-298 |
-5.99% |
Ralls County |
10,355 |
10,167 |
188 |
1.85% |
Randolph County |
24,716 |
25,414 |
-698 |
-2.75% |
Ray County |
23,158 |
23,494 |
-336 |
-1.43% |
Reynolds County |
6,096 |
6,696 |
-600 |
-8.96% |
Ripley County |
10,679 |
14,100 |
-3,421 |
-24.26% |
St. Charles County |
405,262 |
360,485 |
44,777 |
12.42% |
St. Clair County |
9,284 |
9,805 |
-521 |
-5.31% |
Ste. Genevieve County |
18,479 |
18,145 |
334 |
1.84% |
St. Francois County |
66,922 |
65,359 |
1,563 |
2.39% |
St. Louis County |
1,004,125 |
998,954 |
5,171 |
0.52% |
Saline County |
23,333 |
23,370 |
-37 |
-0.16% |
Schuyler County |
4,032 |
4,431 |
-399 |
-9.00% |
Scotland County |
4,716 |
4,843 |
-127 |
-2.62% |
Scott County |
38,059 |
39,191 |
-1,132 |
-2.89% |
Shannon County |
7,031 |
8,441 |
-1,410 |
-16.70% |
Shelby County |
6,103 |
6,373 |
-270 |
-4.24% |
Stoddard County |
28,672 |
29,968 |
-1,296 |
-4.32% |
Stone County |
31,076 |
32,202 |
-1,126 |
-3.50% |
Sullivan County |
5,999 |
6,714 |
-715 |
-10.65% |
Taney County |
56,066 |
51,675 |
4,391 |
8.50% |
Texas County |
24,487 |
26,008 |
-1,521 |
-5.85% |
Vernon County |
19,707 |
21,159 |
-1,452 |
-6.86% |
Warren County |
35,532 |
32,513 |
3,019 |
9.29% |
Washington County |
23,514 |
25,195 |
-1,681 |
-6.67% |
Wayne County |
10,974 |
13,521 |
-2,547 |
-18.84% |
Webster County |
39,085 |
36,202 |
2,883 |
7.96% |
Worth County |
1,973 |
2,171 |
-198 |
-9.12% |
Wright County |
18,188 |
18,815 |
-627 |
-3.33% |
St. Louis City |
301,578 |
319,294 |
-17,716 |
-5.55% |
SOURCE: U.S. Bureau of the Census
Missouri Population News Articles
Missouri’s top air polluter saved from possible closure by Trump’s EPA rollbacks – Mar 20, 2025
Kansas, Missouri farmers avoid discussing climate change regardless of opinions, study finds – Mar 18, 2025
Chronic homelessness numbers rose as brutal weather hit Kansas City this winter – Mar 14, 2025
Missouri farming advocates warn of corporate agriculture’s impact on local farms – Mar 10, 2025
Missouri DNR concerned about impact from trash and human waste from Columbia homeless camps – Mar 10, 2025
Missouri Botanical Garden’s first woman president brings focus on climate change – Nov 11, 2024
Drought impacts deepen as crops fail and livestock suffers across the nation – Oct 18, 2024
Missouri power plant named 2nd highest air polluter in the nation for 2023 – Oct 18, 2024
TARGET 8: Investigating the politics and effects of illegal immigration in Missouri – Sept 5, 2024
Missouri Drought Conditions Are the 10th Worst in the U.S. – Sept 4, 2024
Missouri and the Midwest are gearing up for water fights fueled by climate change – Aug 30, 2024
As SW Missouri population increases, businesses are seeking out bilingual employees – Aug 27, 2024
Counties with the worst droughts in Missouri – Aug 23, 2024
Franklin County sees modest population gain – Mar 16, 2024
Counties with the worst droughts in Missouri – Mar 14, 2024
Feeling Dirty? 3 Missouri Cities Among the Filthiest in America – Mar 10, 2024
Where refugees in Missouri are arriving from – Mar 7, 2024
Missouri tackles the stench and health hazards of meatpacking waste – Mar 4, 2024
July Temperatures Arriving in Missouri, But It’s Still February? – Feb 23, 2024
Shifting demographics: St. Louis City’s population halves over half-century, but Greater Metro Area unfazed – September 20, 2023
With new newspaper and new businesses, Afghan refugees finding new community in Missouri – September 18, 2023
Drought Assessment Committee meets Oct. 4 – September 18, 2023
Missouri manufacturer faces accusations it polluted drinking water in the Bootheel – September 8, 2023
In half a century, this St. Louis suburb grew from 500 to 50,000+ people – August 30, 2023
Extreme heat is coming. What is St. Louis doing about ‘the silent killer’ of climate change? – June 21, 2023
Missouri drought conditions raise pollution concerns – June 15, 2023
Discover the 7 Fastest-Growing Counties in Missouri – June 6, 2023
Missouri Is a Top State for Climate Disasters – June 1, 2023
St. Louis among US cities with the dirtiest air – May 28, 2023
Sulfur dioxide pollution in the Bootheel breaks EPA rules. Regulators look to fix it – November 30, 2022
High concentrations of dangerous ‘forever chemicals’ found in Midwestern rivers, report shows – November 14, 2022
Most coal plants in Missouri are causing toxic groundwater pollution – November 22, 2022
After a year of extreme floods and severe drought, what is Missouri doing about climate change? – November 3, 2022
Missouri’s river levels showing results of drought – November 2, 2022
Ameren Missouri to add more renewable energy — and fracked gas — in updated plan – June 23, 2022
Missouri farmers desperate for rain as future of crops hangs in the balance – June 20, 2022
How microplastics are threatening water and land across Missouri – June 20, 2022
Missouri youth channel climate anxiety to fight for environment-saving action – June 9, 2022
Unprecedented Flooding Spurs Hydrology Office in Missouri – February 25, 2022
Missouri Automotive Lubricant Company Agrees to Pay Penalty for Alleged Environmental Law Violations – February 22, 2022
Winters are getting warmer across the Midwest. That’s affecting Missouri farmers – February 17, 2022
Fastest growing cities in Missouri – February 12, 2022
Missouri non-compliant in sending EPA pollution plans – February 8, 2022