
Mississippi
Click the links below to view state facts.
Mississippi Population News Articles
Population Density
Historic & Projected Growth
Population by County
POPULATION DENSITY
People per square mile, 2010: 63.2
People per square mile, 2020: 63.1
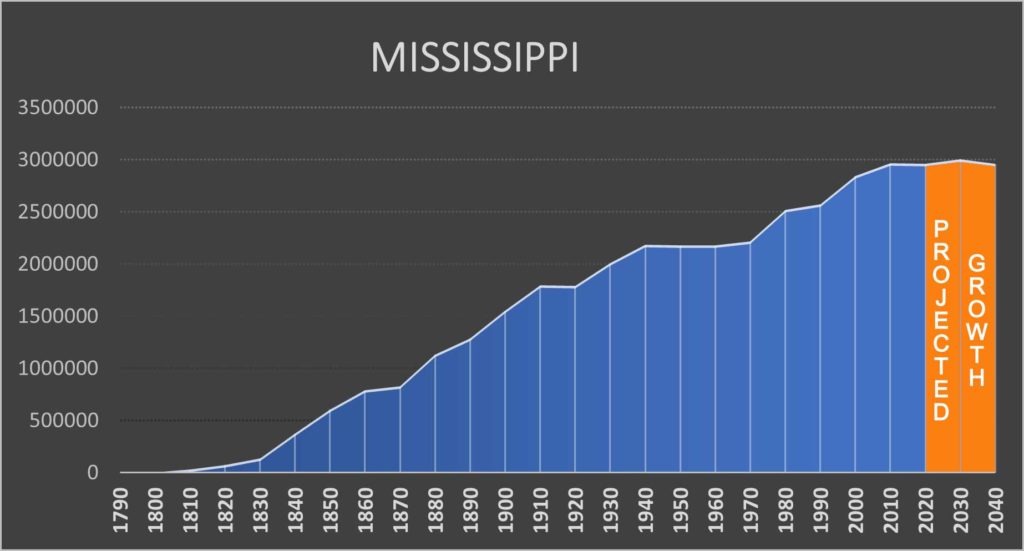
HISTORIC & PROJECTED GROWTH 1790 TO 2040
Year |
Population |
1790 |
0 |
1800 |
7,600 |
1810 |
31,306 |
1820 |
75,448 |
1830 |
136,621 |
1840 |
375,651 |
1850 |
606,526 |
1860 |
791,305 |
1870 |
827,922 |
1880 |
1,131,597 |
1890 |
1,289,600 |
1900 |
1,551,270 |
1910 |
1,797,114 |
1920 |
1,790,618 |
1930 |
2,009,821 |
1940 |
2,183,796 |
1950 |
2,178,914 |
1960 |
2,178,141 |
1970 |
2,216,994 |
1980 |
2,520,770 |
1990 |
2,573,216 |
2000 |
2,844,658 |
2010 |
2,967,297 |
2020 |
2,961,279 |
2030 |
3,003,963 |
2040 |
2,962,160 |
SOURCE: U.S. Bureau of the Census & Weldon Cooper Center, Demographics Research Group
(The Census Bureau and Weldon Cooper Center have not yet provided updated State projections to reflect 2020 census numbers.)
Population by County
Population By County |
Census 2020 Population |
Census 2010 Population |
Change from 2000 |
Percent Change |
MISSISSIPPI |
2,961,279 |
2,967,297 |
-6,018 |
-0.20% |
Adams County |
29,538 |
32,297 |
-2,759 |
-9.34% |
Alcorn County |
34,740 |
37,057 |
-2,317 |
-6.67% |
Amite County |
12,720 |
13,131 |
-411 |
-3.23% |
Attala County |
17,889 |
19,564 |
-1,675 |
-9.36% |
Benton County |
7,646 |
8,729 |
-1,083 |
-14.16% |
Bolivar County |
30,985 |
34,145 |
-3,160 |
-10.20% |
Calhoun County |
13,266 |
14,962 |
-1,696 |
-12.78% |
Carroll County |
9,998 |
10,597 |
-599 |
-5.99% |
Chickasaw County |
17,106 |
17,392 |
-286 |
-1.67% |
Choctaw County |
8,246 |
8,547 |
-301 |
-3.65% |
Claiborne County |
9,135 |
9,604 |
-469 |
-5.13% |
Clarke County |
15,615 |
16,732 |
-1,117 |
-7.15% |
Clay County |
18,636 |
20,634 |
-1,998 |
-10.72% |
Coahoma County |
21,390 |
26,151 |
-4,761 |
-22.26% |
Copiah County |
28,368 |
29,449 |
-1,081 |
-3.81% |
Covington County |
18,340 |
19,568 |
-1,228 |
-6.70% |
DeSoto County |
185,314 |
161,252 |
24,062 |
12.98% |
Forrest County |
78,158 |
74,934 |
3,224 |
4.12% |
Franklin County |
7,675 |
8,118 |
-443 |
-5.77% |
George County |
24,350 |
22,578 |
1,772 |
7.28% |
Greene County |
13,530 |
14,400 |
-870 |
-6.43% |
Grenada County |
21,629 |
21,906 |
-277 |
-1.28% |
Hancock County |
46,053 |
43,929 |
2,124 |
4.61% |
Harrison County |
208,621 |
187,105 |
21,516 |
10.31% |
Hinds County |
227,742 |
245,285 |
-17,543 |
-7.70% |
Holmes County |
17,000 |
19,198 |
-2,198 |
-12.93% |
Humphreys County |
7,785 |
9,375 |
-1,590 |
-20.42% |
Issaquena County |
1,338 |
1,406 |
-68 |
-5.08% |
Itawamba County |
23,863 |
23,401 |
462 |
1.94% |
Jackson County |
143,252 |
139,668 |
3,584 |
2.50% |
Jasper County |
16,367 |
17,062 |
-695 |
-4.25% |
Jefferson County |
7,260 |
7,726 |
-466 |
-6.42% |
Jefferson Davis County |
11,321 |
12,487 |
-1,166 |
-10.30% |
Jones County |
67,246 |
67,761 |
-515 |
-0.77% |
Kemper County |
8,988 |
10,456 |
-1,468 |
-16.33% |
Lafayette County |
55,813 |
47,351 |
8,462 |
15.16% |
Lamar County |
64,222 |
55,658 |
8,564 |
13.33% |
Lauderdale County |
72,984 |
80,261 |
-7,277 |
-9.97% |
Lawrence County |
12,016 |
12,929 |
-913 |
-7.60% |
Leake County |
21,275 |
23,805 |
-2,530 |
-11.89% |
Lee County |
83,343 |
82,910 |
433 |
0.52% |
Leflore County |
28,339 |
32,317 |
-3,978 |
-14.04% |
Lincoln County |
34,907 |
34,869 |
38 |
0.11% |
Lowndes County |
58,879 |
59,779 |
-900 |
-1.53% |
Madison County |
109,145 |
95,203 |
13,942 |
12.77% |
Marion County |
24,441 |
27,088 |
-2,647 |
-10.83% |
Marshall County |
33,752 |
37,144 |
-3,392 |
-10.05% |
Monroe County |
34,180 |
36,989 |
-2,809 |
-8.22% |
Montgomery County |
9,822 |
10,925 |
-1,103 |
-11.23% |
Neshoba County |
29,087 |
29,676 |
-589 |
-2.02% |
Newton County |
21,291 |
21,720 |
-429 |
-2.01% |
Noxubee County |
10,285 |
11,545 |
-1,260 |
-12.25% |
Oktibbeha County |
51,788 |
47,671 |
4,117 |
7.95% |
Panola County |
33,208 |
34,707 |
-1,499 |
-4.51% |
Pearl River County |
56,145 |
55,834 |
311 |
0.55% |
Perry County |
11,511 |
12,250 |
-739 |
-6.42% |
Pike County |
40,324 |
40,404 |
-80 |
-0.20% |
Pontotoc County |
31,184 |
29,957 |
1,227 |
3.93% |
Prentiss County |
25,008 |
25,276 |
-268 |
-1.07% |
Quitman County |
6,176 |
8,223 |
-2,047 |
-33.14% |
Rankin County |
157,031 |
141,617 |
15,414 |
9.82% |
Scott County |
27,990 |
28,264 |
-274 |
-0.98% |
Sharkey County |
3,800 |
4,916 |
-1,116 |
-29.37% |
Simpson County |
25,949 |
27,503 |
-1,554 |
-5.99% |
Smith County |
14,209 |
16,491 |
-2,282 |
-16.06% |
Stone County |
18,333 |
17,786 |
547 |
2.98% |
Sunflower County |
25,971 |
29,450 |
-3,479 |
-13.40% |
Tallahatchie County |
12,715 |
15,378 |
-2,663 |
-20.94% |
Tate County |
28,064 |
28,886 |
-822 |
-2.93% |
Tippah County |
21,815 |
22,232 |
-417 |
-1.91% |
Tishomingo County |
18,850 |
19,593 |
-743 |
-3.94% |
Tunica County |
9,782 |
10,778 |
-996 |
-10.18% |
Union County |
27,777 |
27,134 |
643 |
2.31% |
Walthall County |
13,884 |
15,443 |
-1,559 |
-11.23% |
Warren County |
44,722 |
48,773 |
-4,051 |
-9.06% |
Washington County |
44,922 |
51,137 |
-6,215 |
-13.84% |
Wayne County |
19,779 |
20,747 |
-968 |
-4.89% |
Webster County |
9,926 |
10,253 |
-327 |
-3.29% |
Wilkinson County |
8,587 |
9,878 |
-1,291 |
-15.03% |
Winston County |
17,714 |
19,198 |
-1,484 |
-8.38% |
Yalobusha County |
12,481 |
12,678 |
-197 |
-1.58% |
Yazoo County |
26,743 |
28,065 |
-1,322 |
-4.94% |
SOURCE: U.S. Bureau of the Census
Mississippi Population News Articles
Bacterial advisories issued for some Mississippi beachesv – Mar 21, 2025
Immigrants make up 3.4% of Mississippi’s workforce – Mar 8, 2025
Trump withdraws new pipeline rules inspired by CO2 leaks in Mississippi, Louisiana – Mar 7, 2025
Proposed legislation aims to protect Mississippi River fisheries – Mar 6, 2025
Nixing Efforts to Fight Climate Change and Protect Environment, Trump Administration Follows Project 2025 Blueprint – Mar 6, 2025
Mississippi is second worst in US for wildlife protection: report – Mar 1, 2025
New report ranks Mississippi infrastructure – Nov 14, 2024
Counties with the worst droughts in Mississippi – Nov 1, 2024
EPA sending more than $33 million to Jackson for water infrastructure upgrades – Oct 24
Mississippi regulators to solar boosters: Sit down and be quiet -Sept 3, 2024
Why Mississippi coal is powering Georgia’s data centers – Aug 28, 2024
How illegal immigration hurts Mississippi taxpayers – Aug 19, 2024
Mississippi failed to enforce safe water standards, leading to Jackson’s water crisis – Aug 14, 2024
Ex-employees sue Water Valley facility over TCE pollution – June 5, 2024
Biloxi, Mississippi, is losing a foot of salt marsh shoreline a year – May 17, 2024
Community science inspires action in Pascagoula, Mississippi – May 15, 2024
Mississippi’s growing Latinx population creates space to celebrate – October 2, 2023
Wildfires burn 14k acres in Mississippi, other states send aid – September 28, 2023
‘Hot, hot, hot’: Historic heat and drought taking toll on state’s agriculture – September 26, 2023
First Alert: South Mississippi’s drought intensifies to worst level – September 21, 2023
Oxford is America’s second-fastest growing college town: study – September 13, 2023
Extreme heat days are on the rise across the US: Where Hattiesburg, Mississippi stands – June 24, 2023
LAMAR COUNTY RANKED AS SECOND-FASTEST GROWING COUNTY IN MISSISSIPPI – June 16, 2023
Discover the June Heatwave That Turned Mississippi Into a Fiery Oven – June 13, 2023
Air quality is down in Mississippi. How do I monitor it? – June 9, 2023
Report: Mississippi infrastructure is a big expense for drivers – June 1, 2023
Transcript: This is Climate: Local Solutions – December 7, 2022
State of Success: Mississippi – November 30, 2022
Homeless for the Holidays: Several resources work to combat Tupelo’s homeless – November 16, 2022
Undercounted Census numbers hurt state funding, affect political landscape – June 22, 2022
Mississippi gas storage facility sending half a ton of methane into the atmosphere every hour – June 22, 2022
The 2021 Jackson water crisis and the cracks that remain in a long-damaged system – February 25, 2022
More than a home: Mississippi organizations come together to mitigate homelessness – February 18, 2022