
Ohio
Click the links below to view state facts.
Ohio Population News Articles
Population Density
Historic & Projected Growth
Population by County
POPULATION DENSITY
People per square mile, 2010: 282.3
People per square mile, 2020: 288.8
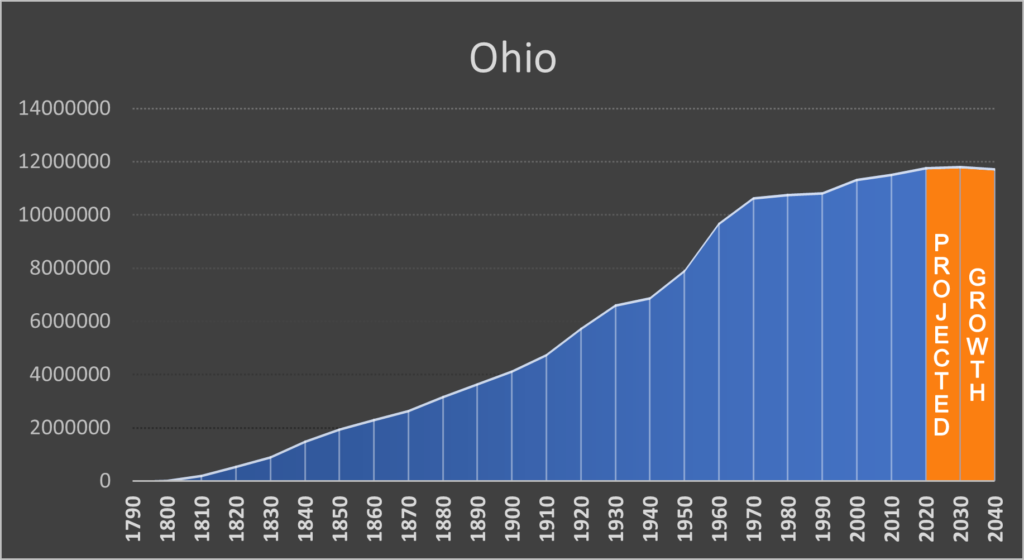
HISTORIC & PROJECTED GROWTH 1790 TO 2040
Year |
Population |
1790 |
0 |
1800 |
45,365 |
1810 |
230,760 |
1820 |
581,434 |
1830 |
937,903 |
1840 |
1,519,467 |
1850 |
1,980,329 |
1860 |
2,339,511 |
1870 |
2,665,260 |
1880 |
3,198,062 |
1890 |
3,672,329 |
1900 |
4,157,545 |
1910 |
4,767,121 |
1920 |
5,759,394 |
1930 |
6,646,697 |
1940 |
6,907,612 |
1950 |
7,946,627 |
1960 |
9,706,397 |
1970 |
10,657,423 |
1980 |
10,797,603 |
1990 |
10,847,115 |
2000 |
11,353,140 |
2010 |
11,536,504 |
2020 |
11,799,448 |
2030 |
11,837,405 |
2040 |
11,751,540 |
Sources: Census figures from U.S. Bureau of the Census & *Estimates from Weldon Cooper Center, Demographics Research Group
(The Census Bureau and Weldon Cooper Center have not yet provided updated State projections to reflect 2020 census numbers.)
Population by County
Census 2010 Population |
Census 2000 Population |
Change from 2000 |
Percent Change |
|
OHIO |
11,799,448 |
11,536,504 |
262,944 |
2.28% |
Adams County |
27477 |
28,550 |
-1,073 |
-3.76% |
Allen County |
102206 |
106,331 |
-4,125 |
-3.88% |
Ashland County |
52447 |
53,139 |
-692 |
-1.30% |
Ashtabula County |
97574 |
101,497 |
-3,923 |
-3.87% |
Athens County |
62431 |
64,757 |
-2,326 |
-3.59% |
Auglaize County |
46422 |
45,949 |
473 |
1.03% |
Belmont County |
66497 |
70,400 |
-3,903 |
-5.54% |
Brown County |
43676 |
44,846 |
-1,170 |
-2.61% |
Butler County |
390357 |
368,130 |
22,227 |
6.04% |
Carroll County |
26721 |
28,836 |
-2,115 |
-7.33% |
Champaign County |
38714 |
40,097 |
-1,383 |
-3.45% |
Clark County |
136001 |
138,333 |
-2,332 |
-1.69% |
Clermont County |
208601 |
197,363 |
11,238 |
5.69% |
Clinton County |
42018 |
42,040 |
-22 |
-0.05% |
Columbiana County |
101877 |
107,841 |
-5,964 |
-5.53% |
Coshocton County |
36612 |
36,901 |
-289 |
-0.78% |
Crawford County |
42025 |
43,784 |
-1,759 |
-4.02% |
Cuyahoga County |
1264817 |
1,280,122 |
-15,305 |
-1.20% |
Darke County |
51881 |
52,959 |
-1,078 |
-2.04% |
Defiance County |
38286 |
39,037 |
-751 |
-1.92% |
Delaware County |
214124 |
174,214 |
39,910 |
22.91% |
Erie County |
75622 |
77,079 |
-1,457 |
-1.89% |
Fairfield County |
158921 |
146,156 |
12,765 |
8.73% |
Fayette County |
28951 |
29,030 |
-79 |
-0.27% |
Franklin County |
1323807 |
1,163,414 |
160,393 |
13.79% |
Fulton County |
42713 |
42,698 |
15 |
0.04% |
Gallia County |
29220 |
30,934 |
-1,714 |
-5.54% |
Geauga County |
95397 |
93,389 |
2,008 |
2.15% |
Greene County |
167966 |
161,573 |
6,393 |
3.96% |
Guernsey County |
38438 |
40,087 |
-1,649 |
-4.11% |
Hamilton County |
830639 |
802,374 |
28,265 |
3.52% |
Hancock County |
74920 |
74,782 |
138 |
0.18% |
Hardin County |
30696 |
32,058 |
-1,362 |
-4.25% |
Harrison County |
14483 |
15,864 |
-1,381 |
-8.71% |
Henry County |
27662 |
28,215 |
-553 |
-1.96% |
Highland County |
43317 |
43,589 |
-272 |
-0.62% |
Hocking County |
28050 |
29,380 |
-1,330 |
-4.53% |
Holmes County |
44223 |
42,366 |
1,857 |
4.38% |
Huron County |
58565 |
59,626 |
-1,061 |
-1.78% |
Jackson County |
32653 |
33,225 |
-572 |
-1.72% |
Jefferson County |
65249 |
69,709 |
-4,460 |
-6.40% |
Knox County |
62721 |
60,921 |
1,800 |
2.95% |
Lake County |
232603 |
230,041 |
2,562 |
1.11% |
Lawrence County |
58240 |
62,450 |
-4,210 |
-6.74% |
Licking County |
178519 |
166,492 |
12,027 |
7.22% |
Logan County |
46150 |
45,858 |
292 |
0.64% |
Lorain County |
312964 |
301,356 |
11,608 |
3.85% |
Lucas County |
431279 |
441,815 |
-10,536 |
-2.38% |
Madison County |
43824 |
43,435 |
389 |
0.90% |
Mahoning County |
228614 |
238,823 |
-10,209 |
-4.27% |
Marion County |
65359 |
66,501 |
-1,142 |
-1.72% |
Medina County |
182470 |
172,332 |
10,138 |
5.88% |
Meigs County |
22210 |
23,770 |
-1,560 |
-6.56% |
Mercer County |
42528 |
40,814 |
1,714 |
4.20% |
Miami County |
108774 |
102,506 |
6,268 |
6.11% |
Monroe County |
13385 |
14,642 |
-1,257 |
-8.58% |
Montgomery County |
537309 |
535,153 |
2,156 |
0.40% |
Morgan County |
13802 |
15,054 |
-1,252 |
-8.32% |
Morrow County |
34950 |
34,827 |
123 |
0.35% |
Muskingum County |
86410 |
86,074 |
336 |
0.39% |
Noble County |
14115 |
14,645 |
-530 |
-3.62% |
Ottawa County |
40364 |
41,428 |
-1,064 |
-2.57% |
Paulding County |
18806 |
19,614 |
-808 |
-4.12% |
Perry County |
35408 |
36,058 |
-650 |
-1.80% |
Pickaway County |
58539 |
55,698 |
2,841 |
5.10% |
Pike County |
27088 |
28,709 |
-1,621 |
-5.65% |
Portage County |
161791 |
161,419 |
372 |
0.23% |
Preble County |
40999 |
42,270 |
-1,271 |
-3.01% |
Putnam County |
34451 |
34,499 |
-48 |
-0.14% |
Richland County |
124936 |
124,475 |
461 |
0.37% |
Ross County |
77093 |
78,064 |
-971 |
-1.24% |
Sandusky County |
58896 |
60,944 |
-2,048 |
-3.36% |
Scioto County |
74008 |
79,499 |
-5,491 |
-6.91% |
Seneca County |
55069 |
56,745 |
-1,676 |
-2.95% |
Shelby County |
48230 |
49,423 |
-1,193 |
-2.41% |
Stark County |
374853 |
375,586 |
-733 |
-0.20% |
Summit County |
540428 |
541,781 |
-1,353 |
-0.25% |
Trumbull County |
201977 |
210,312 |
-8,335 |
-3.96% |
Tuscarawas County |
93263 |
92,582 |
681 |
0.74% |
Union County |
62784 |
52,300 |
10,484 |
20.05% |
Van Wert County |
28931 |
28,744 |
187 |
0.65% |
Vinton County |
12800 |
13,435 |
-635 |
-4.73% |
Warren County |
242337 |
212,693 |
29,644 |
13.94% |
Washington County |
59771 |
61,778 |
-2,007 |
-3.25% |
Wayne County |
116894 |
114,520 |
2,374 |
2.07% |
Williams County |
37102 |
37,642 |
-540 |
-1.43% |
Wood County |
132248 |
125,488 |
6,760 |
5.39% |
Wyandot County |
21900 |
22,615 |
-715 |
-3.16% |
SOURCE: U.S. Bureau of the Census
Ohio Population News Articles
Lawmakers fear Ohio EPA’s proposed data center permit could harm Lake Erie – Jan 21, 2026
Ohio farmers face weather whiplash – Feb 3, 2026
As air pollution rules sit idle, pressure grows on Cleveland City Council – Feb 3, 1926
Several immigration-related bills await Ohio lawmakers when they come back to work – Jan 28, 2026
Population growth leading to increase in emergency calls – Jan 14, 2026
Hamilton residents voice concerns about chemical plant emissions – Jan 14, 2026
Columbus officials stress water planning as region preps for population, data center boom – Oct 1, 2025
Water reservoirs key to Columbus’ growth as population booms – Sep 29, 2025
Campbell Soup admits to violating Clean Water Act 5,400 times, polluting river – Sep 18, 2025
Steel fallout creates complaints in one Tri-State city – Sep 15, 2025
Ohio drought conditions worsen across state. Will it ever rain? – Sep 11, 2025
Air Quality Alert for central Ohio expires – June 9, 2025
Cleveland population shows second year of estimated growth – May 28, 2025
A Toledo Blade investigation revealed radioactivity in the rural Ohio village of Luckey’s water – May 22, 2025
3 Ohio sheriff’s departments ink agreements with ICE to aid in deportations – May 20, 2025
Climate change is already affecting Ohioans. Here’s what comes next and what can be done – May 19, 2025
TNC applauds Gov. DeWine, Ohio Legislature for securing state’s energy future – May 15, 2025
As Columbus’ population grows, city aims to improve traffic flow – Nov 21, 2024
Study Reveals Ohio’s Growing Struggle to Preserve Agricultural Land – Nov 14, 2024
6 Ohio Cities Named Among The ‘Dirtiest Cities In America’ – Nov 13, 2024
EPA awards Ohio $169M for water infrastructure improvements – Oct 30, 2024
Hundreds tackle population growth at Sustainability Summit – Oct 29, 2024
Extreme drought creeps into Franklin County, exceptional drought takes hold in Pickaway – Sept 6, 2024
Immigration FAQs – Aug 23, 2024
Sharon Lake project to resume after Great Parks approves plan to control drifting lime dust – Aug 21, 2024
Hidden Report Reveals How Workers Got Sick While Cleaning Ohio Derailment Site – Aug 14, 2024
90.3% of Ohio Lakes Are Too Polluted for Swimming – July 19, 2024
Ohio to clean up legacy pollution with $46 million in federal funding – June 14, 2024
6 large cities in Ohio experienced population growth last year. Here they are – May 27, 2024
Feds reach $310M settlement with Norfolk Southern after toxic Ohio train derailment. Here’s what else the company has to do – May 23, 2024
What new methane regulations mean for Ohio – May 21, 2024
Columbus grows again in 2023, according to new Census data, but by how much? – May 18, 2024
Columbus City Council resolution lays path for zoning changes to bring more urban density – October 10, 2023
Hot weather drives Lake Erie toxic algae bloom resurgence – October 4, 2023
How Dangerous Are Ohio Lakes? – September 25, 2023
Clark County leaders work to provide driving education for local Haitians – September 24, 2023
New school vs. old trees: Is a Cleveland park protected from development? The Wake Up for Friday, Sept. 22, 2023 – September 22, 2023
Columbus sees momentum for local tree growing plan – September 20, 2023
Counties with the most farmland in Ohio – July 2, 2023
Columbus council approves more than $11.8M to design fourth water plant to improve capacity – June 27, 2023
Northeast Ohio expected to welcome thousands of Central American, South American refugees, asylum seekers – June 19, 2023
As Columbus population grows, John Glenn International Airport plans accordingly – June 14, 2023
The Largest Landfill in Ohio Is Almost as Tall as the Eiffel Tower – June 12, 2023
Cuyahoga County among Ohio counties where residents are most concerned about climate change – Yale study – December 14, 2022
10 Largest Cities In Ohio By Population – December 2, 2022
Ohio’s largest coal plant to change coal ash handling after U.S. EPA denial – December 2, 2022
New Research Dives into Fracking’s Impact on Water Flow in Ohio – December 2, 2022
Columbus vastly outpacing the rest of Ohio in population, growth – November 15, 2022
Climate Friday | Rainfall in Toledo becoming more intense – July 8, 2022
Where are the companies in Summit County emitting the most toxic chemicals? – July 7, 2022
Houseless population of Heer Park looking for a new home following eviction – June 22, 2022
Ohio State University: As Intel Expands Into Central Ohio, Communities Must Increase Housing, Planners Say – June 11, 2022
With inflation, supply-chain kinks, plight of Ohio food banks grows – March 5, 2022
Coastal workers migrating to Ohio – February 23, 2022
Central Ohio’s growth requires innovative housing solutions, planners say – February 22, 2022
Once sleepy Clermont County booms with subdivisions, new homes – February 16, 2022
Ohio to get $140 million for electric vehicle charging stations from bipartisan infrastructure bill – February 11, 2022